Integrate Litefuse with LlamaIndex
This notebook provides a step-by-step guide on integrating Litefuse with LlamaIndex to achieve observability and debugging for your LLM applications.
What is LlamaIndex? LlamaIndex (GitHub) is an advanced “data framework” tailored for augmenting LLMs with private data. It streamlines the integration of diverse data sources and formats (APIs, PDFs, docs, SQL, etc.) through versatile data connectors and structures data into indices and graphs for LLM compatibility. The platform offers a sophisticated retrieval/query interface for enriching LLM inputs with context-specific outputs.
What is Litefuse? Litefuse is an open-source AI agent observability and evaluation platform. It offers tracing and monitoring capabilities for AI applications. Litefuse helps developers debug, analyze, and optimize their AI systems by providing detailed insights and integrating with a wide array of tools and frameworks through native integrations, OpenTelemetry, and dedicated SDKs.
Getting Started
Let’s walk through a practical example of using LlamaIndex and integrating it with Litefuse for comprehensive tracing.
Step 1: Install Dependencies
%pip install langfuse openinference-instrumentation-llama-index llama-index-llms-openai llama-index -UStep 2: Configure Langfuse SDK
Next, set up your Litefuse API keys. You can get these keys by signing up for a free Litefuse Cloud account or by self-hosting Litefuse. These environment variables are essential for the Langfuse client to authenticate and send data to your Litefuse project.
import os

# Get keys for your project from the project settings page: https://litefuse.cloud

os.environ["LANGFUSE_PUBLIC_KEY"] = "pk-lf-..."
os.environ["LANGFUSE_SECRET_KEY"] = "sk-lf-..."
os.environ["LANGFUSE_BASE_URL"] = "https://litefuse.cloud"

# Your OpenAI key
os.environ["OPENAI_API_KEY"] = "sk-proj-..."
With the environment variables set, we can now initialize the Langfuse client. get_client() initializes the Langfuse client using the credentials provided in the environment variables.
from langfuse import get_client

langfuse = get_client()

# Verify connection
if langfuse.auth_check():
    print("Langfuse client is authenticated and ready!")
else:
    print("Authentication failed. Please check your credentials and host.")
Step 3: Initialize LlamaIndex Instrumentation
Now, we initialize the OpenInference LlamaIndex instrumentation. This third-party instrumentation automatically captures LlamaIndex operations and exports OpenTelemetry (OTel) spans to Litefuse.
from openinference.instrumentation.llama_index import LlamaIndexInstrumentor

# Initialize LlamaIndex instrumentation
LlamaIndexInstrumentor().instrument()
Step 4: Basic LlamaIndex Application
Let’s create a straightforward LlamaIndex application. In this example, we’ll create a simple query engine that can answer questions. This will serve as the foundation for demonstrating Litefuse tracing.
from llama_index.llms.openai import OpenAI

llm = OpenAI(model="gpt-4o")

with langfuse.start_as_current_observation(as_type="span", name="llama-index-trace"):
    response = llm.complete("Hello, world!")
    print(response)

langfuse.flush()
Step 5: View Traces in Litefuse
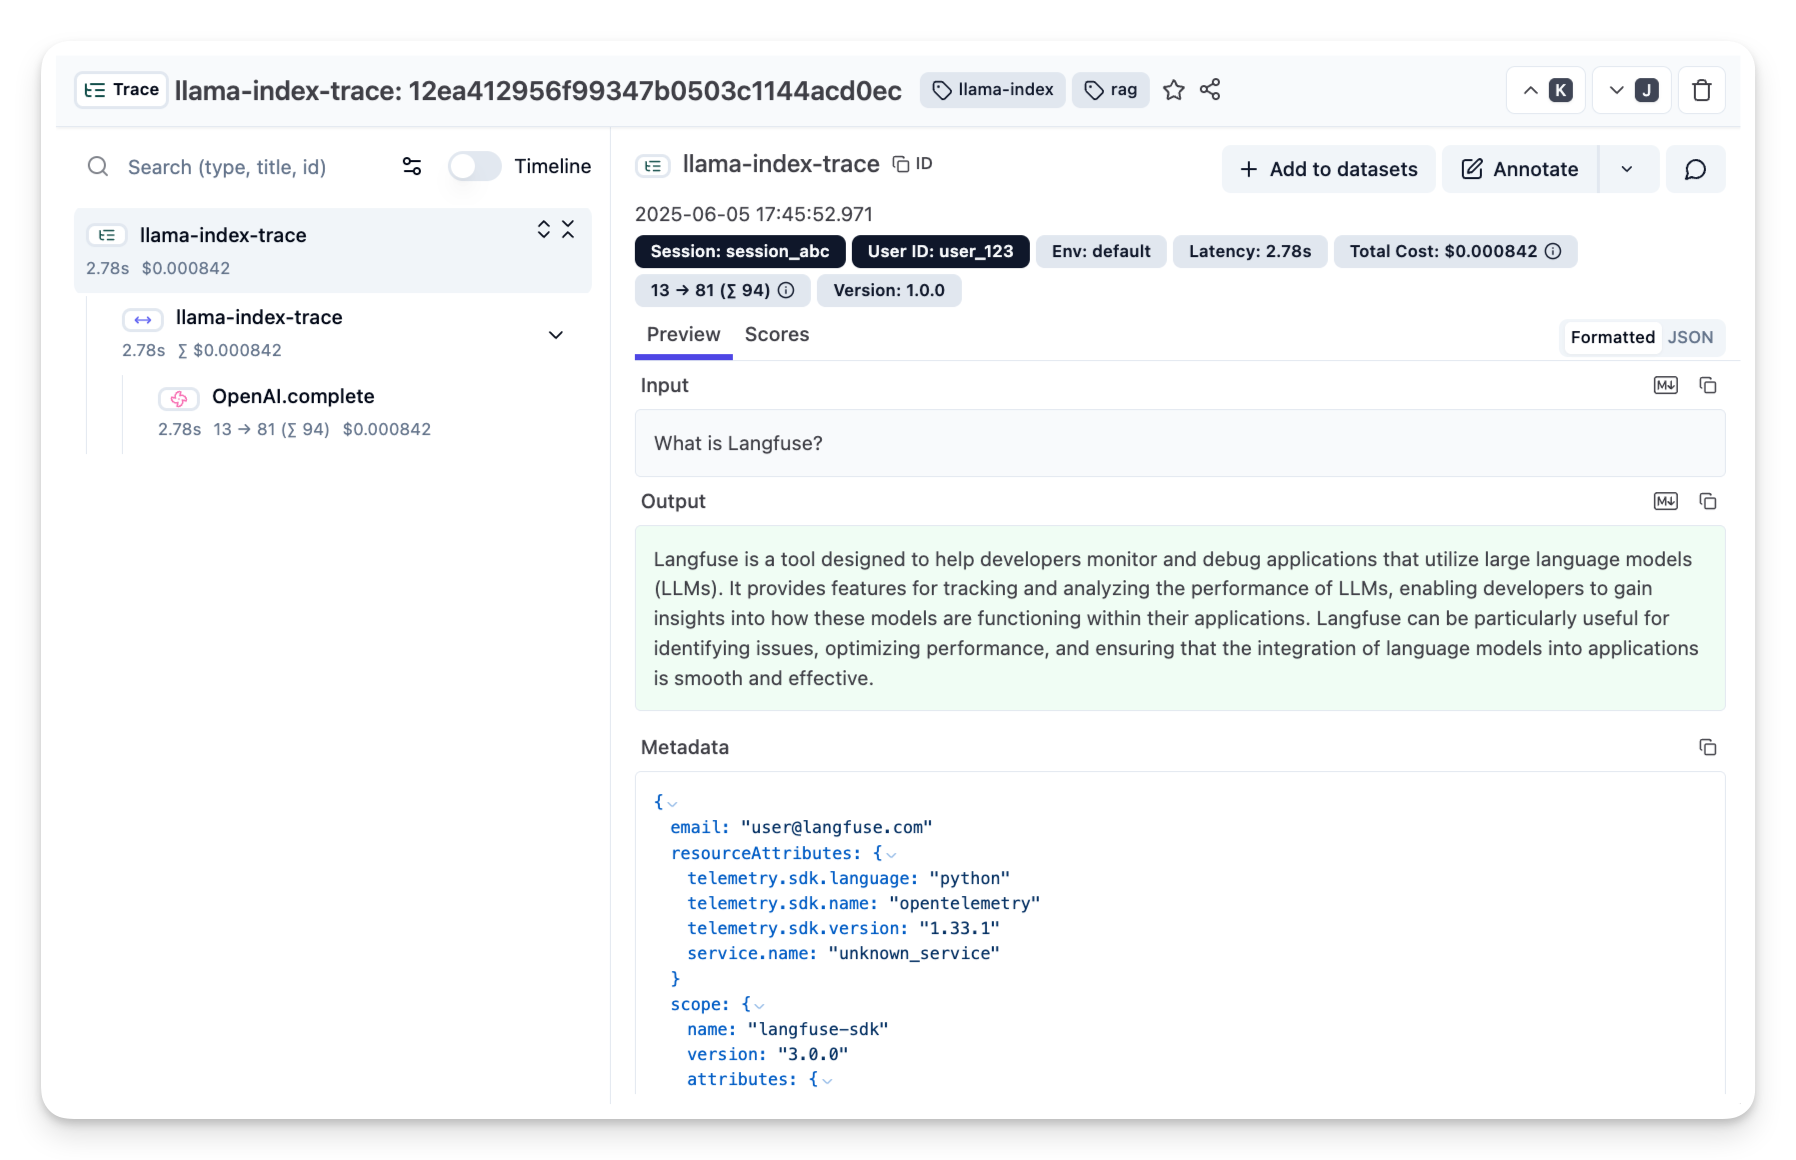
After executing the application, navigate to your Litefuse Trace Table. You will find detailed traces of the application’s execution, providing insights into the LLM calls, retrieval operations, inputs, outputs, and performance metrics. The trace will show the complete flow from query processing through document retrieval to response generation.
Interoperability with the Python SDK
You can use this integration together with the Litefuse SDKs to add additional attributes to the observation.
The @observe() decorator provides a convenient way to automatically wrap your instrumented code and add additional attributes to the observation.
from langfuse import observe, propagate_attributes, get_client

langfuse = get_client()

@observe()
def my_llm_pipeline(input):
    # Add additional attributes (user_id, session_id, metadata, version, tags) to all spans created within this execution scope
    with propagate_attributes(
        user_id="user_123",
        session_id="session_abc",
        tags=["agent", "my-observation"],
        metadata={"email": "user@litefuse.ai"},
        version="1.0.0"
    ):

        # YOUR APPLICATION CODE HERE
        result = call_llm(input)

        return result

# Run the function
my_llm_pipeline("Hi")
Learn more about using the Decorator in the Langfuse SDK instrumentation docs.
Troubleshooting
No observations appearing
First, enable debug mode in the Python SDK:
export LANGFUSE_DEBUG="True"Then run your application and check the debug logs:
- OTel observations appear in the logs: Your application is instrumented correctly but observations are not reaching Litefuse. To resolve this:
- Call
langfuse.flush()at the end of your application to ensure all observations are exported. - Verify that you are using the correct API keys and base URL.
- Call
- No OTel spans in the logs: Your application is not instrumented correctly. Make sure the instrumentation runs before your application code.
Unwanted observations in Litefuse
The Langfuse SDK is based on OpenTelemetry. Other libraries in your application may emit OTel spans that are not relevant to you. These still count toward your billable units, so you should filter them out. See Unwanted spans in Litefuse for details.
Missing attributes
Some attributes may be stored in the metadata object of the observation rather than being mapped to the Litefuse data model. If a mapping or integration does not work as expected, please raise an issue on GitHub.
Next Steps
Once you have instrumented your code, you can manage, evaluate and debug your application: