DSPy - 可观测性与 Tracing
本 cookbook 演示如何在 Litefuse 中使用 DSPy。
什么是 DSPy? DSPy 是一个系统性优化语言模型 prompt 与权重的框架,通过自动化调优过程并提升可靠性,使构建和精化复杂 LM 系统更加容易。关于 DSPy 的更多信息,请查阅 文档。
什么是 Litefuse? Litefuse 是一个开源的 AI Agent 可观测性与评估平台。它为 AI 应用提供 tracing 与监控能力。Litefuse 通过提供详细的洞察以及通过原生集成、OpenTelemetry 和专用 SDK 与众多工具和框架对接,帮助开发者调试、分析并优化其 AI 系统。
前置条件
请安装最新版本的 DSPy 与 litefuse。
%pip install langfuse dspy openinference-instrumentation-dspy -U第 1 步:设置 Litefuse 环境变量
首先,我们配置环境变量。设置 OpenTelemetry endpoint、协议和鉴权 header,使 DSPy 的 trace 能正确发送到 Litefuse。你可以通过注册 Litefuse Cloud 或 自托管 Litefuse 获取你的 Litefuse API Key。
import os

# Get keys for your project from the project settings page: https://litefuse.cloud
os.environ["LANGFUSE_PUBLIC_KEY"] = "pk-lf-..."
os.environ["LANGFUSE_SECRET_KEY"] = "sk-lf-..."
os.environ["LANGFUSE_BASE_URL"] = "https://litefuse.cloud"

# Your OpenAI key
os.environ["OPENAI_API_KEY"] = "sk-proj-..."
设置好环境变量后,我们就可以初始化 Langfuse 客户端了。get_client() 会使用环境变量中提供的凭证来初始化 Langfuse 客户端。
from langfuse import get_client

langfuse = get_client()

# Verify connection
if langfuse.auth_check():
    print("Langfuse client is authenticated and ready!")
else:
    print("Authentication failed. Please check your credentials and host.")
第 2 步:为 DSPy 启用 Tracing
接下来,我们使用面向 DSPy 的 OpenInference Instrumentation 模块自动捕获你的 DSPy trace。只需调用一次即可对 DSPy 的 LM 调用进行 instrument。
from openinference.instrumentation.dspy import DSPyInstrumentor

DSPyInstrumentor().instrument()
第 3 步:配置 DSPy
接下来,我们设置 DSPy。这包括初始化一个语言模型并配置 DSPy 使用它。然后你就可以运行各种展示 DSPy 特性的模块。
import dspy
lm = dspy.LM('openai/gpt-4o-mini')
dspy.configure(lm=lm)
第 4 步:在带可观测性的情况下运行 DSPy 模块
下面是来自 DSPy 文档 的一些示例,展示了核心功能。每个示例都会自动将 trace 数据发送到 Litefuse。
示例 1:使用 Chain-of-Thought 模块(数学推理)
math = dspy.ChainOfThought("question -> answer: float")
math(question="Two dice are tossed. What is the probability that the sum equals two?")
示例 2:构建 RAG 流水线
def search_wikipedia(query: str) -> list[str]:
    results = dspy.ColBERTv2(url='http://20.102.90.50:2017/wiki17_abstracts')(query, k=3)
    return [x['text'] for x in results]

rag = dspy.ChainOfThought('context, question -> response')

question = "What's the name of the castle that David Gregory inherited?"
rag(context=search_wikipedia(question), question=question)
示例 3:使用 DSPy Signature 运行分类模块
def evaluate_math(expression: str):
return dspy.PythonInterpreter({}).execute(expression)
def search_wikipedia(query: str):
results = dspy.ColBERTv2(url='http://20.102.90.50:2017/wiki17_abstracts')(query, k=3)
return [x['text'] for x in results]
react = dspy.ReAct("question -> answer: float", tools=[evaluate_math, search_wikipedia])
pred = react(question="What is 9362158 divided by the year of birth of David Gregory of Kinnairdy castle?")
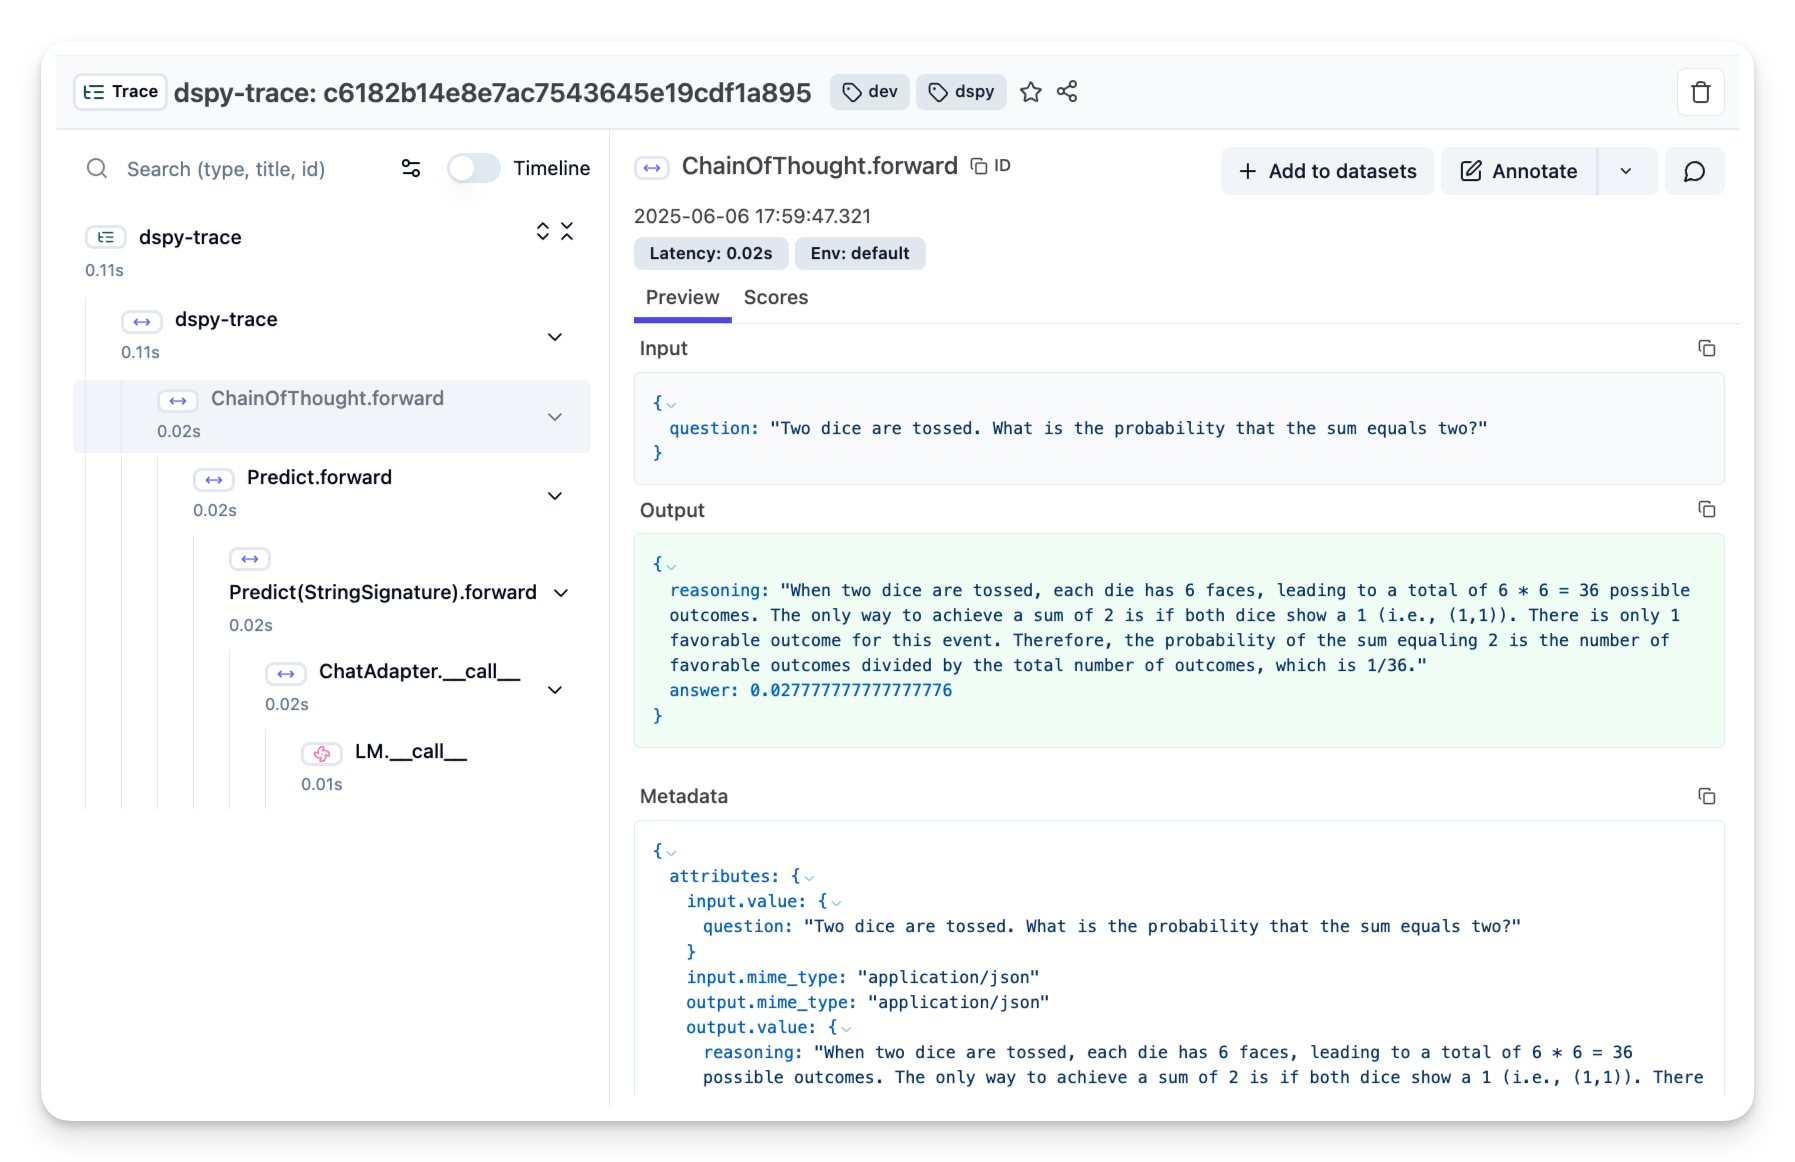
print(pred.answer)第 5 步:在 Litefuse 中查看 Trace
运行你的 DSPy 应用后,可以在 Litefuse 中查看被 trace 的事件:
Interoperability with the Python SDK
You can use this integration together with the Litefuse SDKs to add additional attributes to the observation.
The @observe() decorator provides a convenient way to automatically wrap your instrumented code and add additional attributes to the observation.
from langfuse import observe, propagate_attributes, get_client

langfuse = get_client()

@observe()
def my_llm_pipeline(input):
    # Add additional attributes (user_id, session_id, metadata, version, tags) to all spans created within this execution scope
    with propagate_attributes(
        user_id="user_123",
        session_id="session_abc",
        tags=["agent", "my-observation"],
        metadata={"email": "user@litefuse.ai"},
        version="1.0.0"
    ):

        # YOUR APPLICATION CODE HERE
        result = call_llm(input)

        return result

# Run the function
my_llm_pipeline("Hi")
Learn more about using the Decorator in the Langfuse SDK instrumentation docs.
Troubleshooting
No observations appearing
First, enable debug mode in the Python SDK:
export LANGFUSE_DEBUG="True"Then run your application and check the debug logs:
- OTel observations appear in the logs: Your application is instrumented correctly but observations are not reaching Litefuse. To resolve this:
- Call
langfuse.flush()at the end of your application to ensure all observations are exported. - Verify that you are using the correct API keys and base URL.
- Call
- No OTel spans in the logs: Your application is not instrumented correctly. Make sure the instrumentation runs before your application code.
Unwanted observations in Litefuse
The Langfuse SDK is based on OpenTelemetry. Other libraries in your application may emit OTel spans that are not relevant to you. These still count toward your billable units, so you should filter them out. See Unwanted spans in Litefuse for details.
Missing attributes
Some attributes may be stored in the metadata object of the observation rather than being mapped to the Litefuse data model. If a mapping or integration does not work as expected, please raise an issue on GitHub.
Next Steps
Once you have instrumented your code, you can manage, evaluate and debug your application: