使用 Litefuse 实现 xAI / Grok 的可观测性
本指南将介绍如何通过 OpenAI SDK 将 Grok 与 Litefuse 集成。
什么是 Grok? Grok 是 X.ai 的先进 AI 平台,它简化了用于智能应用集成的自然语言处理。详情请参阅 Grok 文档。
什么是 Litefuse? Litefuse 是一个开源的 AI Agent 可观测性与评估平台,帮助团队追踪 API 调用、监控性能并调试 AI 应用中的问题。
第一步:安装依赖
确保已安装所需的 Python 包:
%pip install openai langfuse第二步:设置环境变量
import os

# Get keys for your project from the project settings page
# https://litefuse.cloud

os.environ["LANGFUSE_PUBLIC_KEY"] = "pk-lf-..."
os.environ["LANGFUSE_SECRET_KEY"] = "sk-lf-..."
os.environ["LANGFUSE_BASE_URL"] = "https://litefuse.cloud"


# Get your Grok API key from your Grok account settings
os.environ["GROK_API_KEY"] = "xai-..."
第三步:通过 OpenAI SDK 使用 Grok
要通过 OpenAI SDK 使用 Grok,我们使用 Litefuse 提供的 OpenAI 替换方案。将 base URL 替换为 Grok 的端点。
# Instead of importing openai directly:
from langfuse.openai import openai

client = openai.OpenAI(
  api_key=os.environ.get("GROK_API_KEY"),
  base_url="https://api.x.ai/v1"  # Grok's endpoint
)
第四步:运行示例
下面的示例演示了如何使用 Grok 的 API 发起一次简单请求。所有 API 调用都会被 Litefuse 自动追踪。
response = client.chat.completions.create(
  model="grok-2-latest",
  messages=[
    {"role": "system", "content": "You are an assistant."},
    {"role": "user", "content": "What is Litefuse?"}
  ],
  name = "Grok-2-Trace"
)

print(response.choices[0].message.content)
第五步:增强追踪(可选)
你可以增强 Grok 的追踪能力:
- 为 trace 添加 metadata、tag、日志级别 和 用户 ID
- 按 会话 对 trace 进行分组
- 使用
@observe()装饰器 追踪额外的应用逻辑 - 使用 Litefuse Prompt Management 并将 prompt 关联到 trace
- 为 trace 添加 score
请查看 OpenAI SDK 指南 获取更多关于传入额外参数的示例。 在 Litefuse 文档 中了解更多 Litefuse 评估和 Prompt Management 的内容。
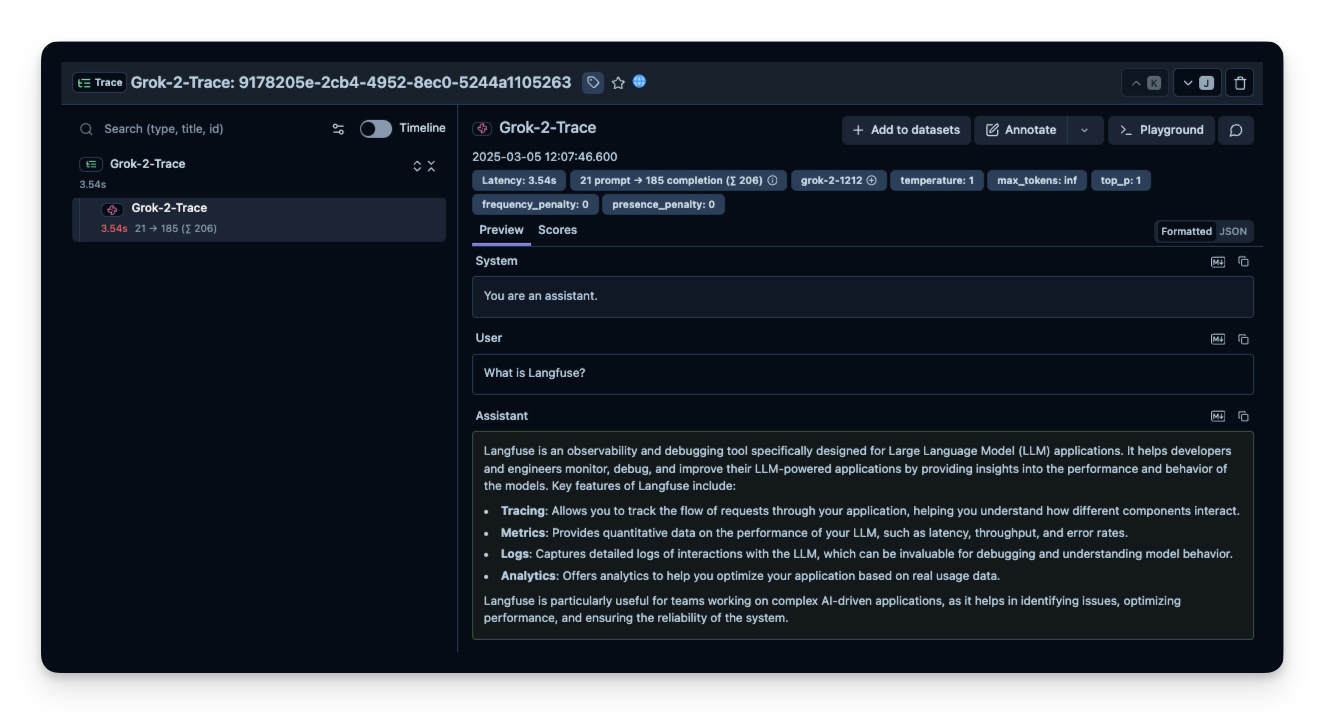
第六步:在 Litefuse 中查看 trace
运行示例后,登录 Litefuse 即可查看详细的 trace,包括:
- 请求参数
- 响应内容
- token 用量和延迟指标
Interoperability with the Python SDK
You can use this integration together with the Litefuse SDKs to add additional attributes to the observation.
The @observe() decorator provides a convenient way to automatically wrap your instrumented code and add additional attributes to the observation.
from langfuse import observe, propagate_attributes, get_client

langfuse = get_client()

@observe()
def my_llm_pipeline(input):
    # Add additional attributes (user_id, session_id, metadata, version, tags) to all spans created within this execution scope
    with propagate_attributes(
        user_id="user_123",
        session_id="session_abc",
        tags=["agent", "my-observation"],
        metadata={"email": "user@litefuse.ai"},
        version="1.0.0"
    ):

        # YOUR APPLICATION CODE HERE
        result = call_llm(input)

        return result

# Run the function
my_llm_pipeline("Hi")
Learn more about using the Decorator in the Langfuse SDK instrumentation docs.
Troubleshooting
No observations appearing
First, enable debug mode in the Python SDK:
export LANGFUSE_DEBUG="True"Then run your application and check the debug logs:
- OTel observations appear in the logs: Your application is instrumented correctly but observations are not reaching Litefuse. To resolve this:
- Call
langfuse.flush()at the end of your application to ensure all observations are exported. - Verify that you are using the correct API keys and base URL.
- Call
- No OTel spans in the logs: Your application is not instrumented correctly. Make sure the instrumentation runs before your application code.
Unwanted observations in Litefuse
The Langfuse SDK is based on OpenTelemetry. Other libraries in your application may emit OTel spans that are not relevant to you. These still count toward your billable units, so you should filter them out. See Unwanted spans in Litefuse for details.
Missing attributes
Some attributes may be stored in the metadata object of the observation rather than being mapped to the Litefuse data model. If a mapping or integration does not work as expected, please raise an issue on GitHub.
Next Steps
Once you have instrumented your code, you can manage, evaluate and debug your application: