Parallel 集成
本指南演示如何将 Litefuse 与 Parallel 集成,追踪你的 AI 任务操作。借助 Litefuse 的追踪能力,你可以自动捕获 Parallel 任务的输入、输出和执行时间等细节。
什么是 Parallel? Parallel 提供一系列 Web 搜索与 Web Agent API,将 AI Agent、应用与工作流连接到开放互联网,支持从简单搜索到复杂知识工作的可编程任务。
什么是 Litefuse? Litefuse 是一个开源的 AI Agent 可观测性与评估平台,帮助团队追踪 API 调用、监控性能并调试 AI 应用中的问题。
快速开始
首先,安装必要的 Python 包:
%pip install langfuse parallel-web openai接下来,使用你的 Parallel 和 Litefuse API Key 配置环境。你可以通过注册免费的 Litefuse Cloud 账号或自托管 Litefuse 获取 Litefuse Key,从 Parallel 控制台 获取 Parallel Key。
import os

# 从项目设置页面获取你项目的 Key:https://litefuse.cloud
os.environ["LANGFUSE_PUBLIC_KEY"] = "pk-lf-..."
os.environ["LANGFUSE_SECRET_KEY"] = "sk-lf-..."
os.environ["LANGFUSE_HOST"] = "https://litefuse.cloud"

# 你的 Parallel key
os.environ["PARALLEL_API_KEY"] = "..."

# 你的 openai key
os.environ["OPENAI_API_KEY"] = "sk-proj-..."
示例 1:追踪 Parallel Task API
我们使用 Litefuse @observe() 装饰器 监控 Task API 请求。本示例中,@observe() 装饰器会捕获 parallel_task() 函数的输入、输出和执行时间。如果你想对发送到 Litefuse 的数据进行更精细的控制,可以使用 Python SDK 的 Context Manager 或手动创建 observation。
import os
from parallel import Parallel
from parallel.types import TaskSpecParam
from langfuse import observe

client = Parallel(api_key=os.environ["PARALLEL_API_KEY"])

@observe(as_type="retriever")
def parallel_task(input: str):
    task_run = client.task_run.create(
        input=input,
        task_spec=TaskSpecParam(
            output_schema="The founding date of the company in the format MM-YYYY"
            ),
        processor="base"
    )
    print(f"Run ID: {task_run.run_id}")

    run_result = client.task_run.result(task_run.run_id, api_timeout=3600)
    print(run_result.output)

    return run_result.output

parallel_task("Langfuse")
示例 2:追踪 Parallel Chat API
你可以使用 Litefuse OpenAI 封装器 来追踪与 Parallel Chat API 的交互:
from langfuse.openai import OpenAI

client = OpenAI(
    api_key=os.environ["PARALLEL_API_KEY"],  # 你的 Parallel API key
    base_url="https://api.parallel.ai"  # Parallel 的 API beta endpoint
)

response = client.chat.completions.create(
    model="speed", # Parallel 模型名
    name="Parallel Chat",
    messages=[
        {"role": "user", "content": "What does Parallel Web Systems do?"}
    ],
    response_format={
        "type": "json_schema",
        "json_schema": {
            "name": "reasoning_schema",
            "schema": {
                "type": "object",
                "properties": {
                    "reasoning": {
                        "type": "string",
                        "description": "Think step by step to arrive at the answer",
                    },
                    "answer": {
                        "type": "string",
                        "description": "The direct answer to the question",
                    },
                    "citations": {
                        "type": "array",
                        "items": {"type": "string"},
                        "description": "Sources cited to support the answer",
                    },
                },
            },
        },
    },
)

print(response.choices[0].message.content)
示例 3:Parallel Search API 与 OpenAI
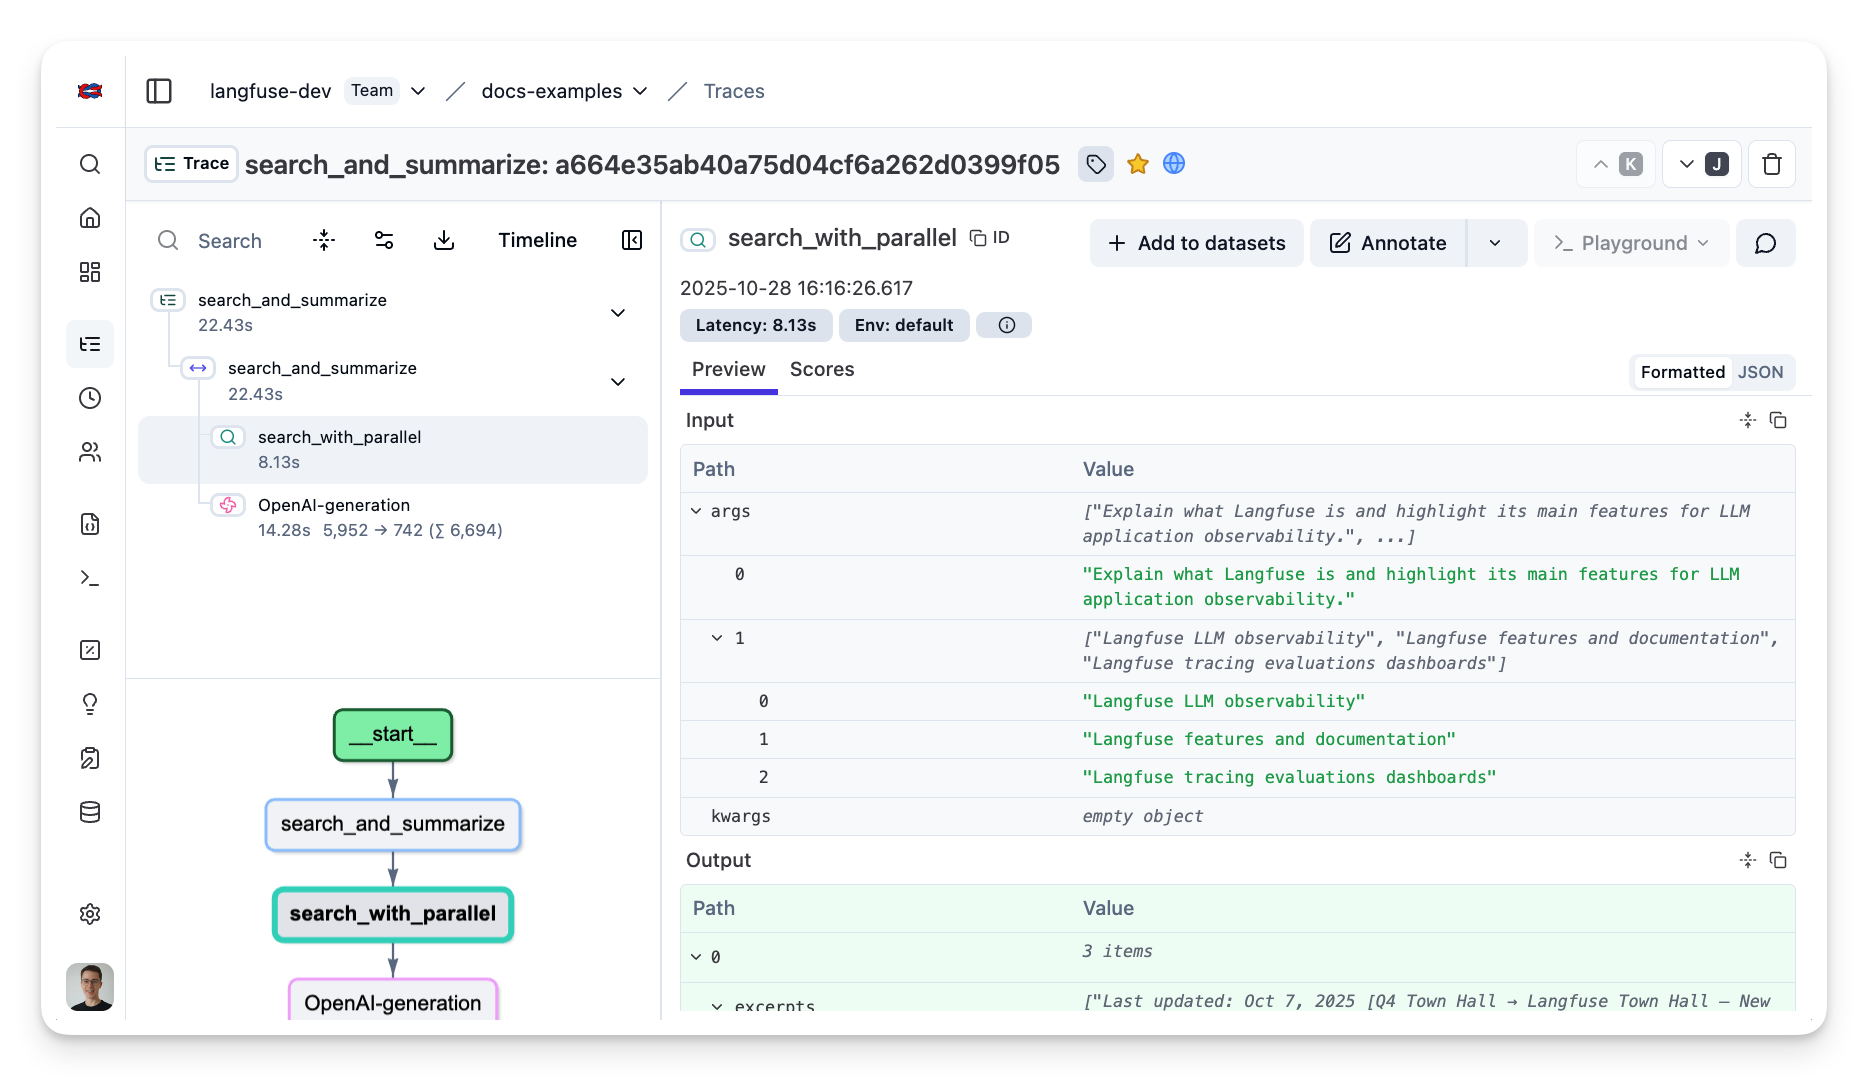
你也可以追踪更复杂的工作流,比如用 OpenAI 总结搜索结果。这里我们使用 Litefuse @observe() 装饰器 把 Parallel 搜索和 OpenAI 生成合并到同一个 trace 中。
import os
from parallel import Parallel
from langfuse.openai import OpenAI
from langfuse import observe


@observe()
def search_and_summarize(objective, search_queries):
    # 1. Parallel Search API
    parallel_client = Parallel(api_key=os.environ["PARALLEL_API_KEY"])

    @observe(as_type="retriever")
    def search_with_parallel(objective, search_queries, num_results: int = 5):
        """Search the web using Parallel and return results."""
        search = parallel_client.beta.search(
            objective=objective,
            search_queries=search_queries,
            processor="base",
            max_results=num_results,
            max_chars_per_result=6000
        )
        return search.results

    results = search_with_parallel(objective, search_queries)
    results_text = "\n\n".join(str(r) for r in results) if results else "No results."

    # 2. 用 OpenAI 进行总结
    openai_client = OpenAI()
    resp = openai_client.chat.completions.create(
        model="gpt-5-mini",
        messages=[
            {"role": "system", "content": "Summarize the following search results clearly and concisely."},
            {"role": "user", "content": results_text}
        ]
    )
    return resp.choices[0].message.content

# 示例用法
search_and_summarize(
    objective="Explain what Litefuse is and highlight its main features for AI agent observability.",
    search_queries=[
        "Litefuse AI agent observability",
        "Litefuse features and documentation",
        "Litefuse tracing evaluations dashboards"
    ],
)
在 Litefuse 中查看 trace
执行完上述被追踪的函数后,登录你的 Litefuse 仪表盘 查看详细的 trace 日志。你将能看到:
- 单个任务的创建与获取操作
- 并行执行的模式与耗时
- 输入 prompt 与输出结果
- 每个任务的性能指标
Interoperability with the Python SDK
You can use this integration together with the Litefuse SDKs to add additional attributes to the observation.
The @observe() decorator provides a convenient way to automatically wrap your instrumented code and add additional attributes to the observation.
from langfuse import observe, propagate_attributes, get_client

langfuse = get_client()

@observe()
def my_llm_pipeline(input):
    # Add additional attributes (user_id, session_id, metadata, version, tags) to all spans created within this execution scope
    with propagate_attributes(
        user_id="user_123",
        session_id="session_abc",
        tags=["agent", "my-observation"],
        metadata={"email": "user@litefuse.ai"},
        version="1.0.0"
    ):

        # YOUR APPLICATION CODE HERE
        result = call_llm(input)

        return result

# Run the function
my_llm_pipeline("Hi")
Learn more about using the Decorator in the Langfuse SDK instrumentation docs.
Troubleshooting
No observations appearing
First, enable debug mode in the Python SDK:
export LANGFUSE_DEBUG="True"Then run your application and check the debug logs:
- OTel observations appear in the logs: Your application is instrumented correctly but observations are not reaching Litefuse. To resolve this:
- Call
langfuse.flush()at the end of your application to ensure all observations are exported. - Verify that you are using the correct API keys and base URL.
- Call
- No OTel spans in the logs: Your application is not instrumented correctly. Make sure the instrumentation runs before your application code.
Unwanted observations in Litefuse
The Langfuse SDK is based on OpenTelemetry. Other libraries in your application may emit OTel spans that are not relevant to you. These still count toward your billable units, so you should filter them out. See Unwanted spans in Litefuse for details.
Missing attributes
Some attributes may be stored in the metadata object of the observation rather than being mapped to the Litefuse data model. If a mapping or integration does not work as expected, please raise an issue on GitHub.
Next Steps
Once you have instrumented your code, you can manage, evaluate and debug your application: