使用 Litefuse Trace LiveKit Agent
本指南演示如何将 Litefuse 与 LiveKit Agents 集成,对实时语音 AI 应用进行可观测性与 tracing。按照这些步骤操作,你将能在 Litefuse 控制台中监控、调试并评估你的 LiveKit Agent。
什么是 LiveKit Agents? LiveKit Agents (GitHub) 是一个开源 Python 与 Node.js 框架,用于构建生产级的多模态和语音 AI Agent。它提供了完整的工具和抽象,将实时媒体输入到 AI 流水线中,支持高性能的 STT-LLM-TTS 语音流水线,也支持任何 AI 提供方的语音到语音模型。
什么是 Litefuse? Litefuse 是一个开源的 AI Agent 可观测性与评估平台。它为 AI 应用提供 tracing 与监控能力。Litefuse 通过提供详细的洞察以及通过原生集成、OpenTelemetry 和专用 SDK 与众多工具和框架对接,帮助开发者调试、分析并优化其 AI 系统。
快速开始
LiveKit Agents 内置了对 OpenTelemetry 的支持。Langfuse Python SDK 可以注册为 OpenTelemetry span exporter,所以你只需要创建一个 TracerProvider,将其交给 LiveKit 与 Litefuse,trace 就会自动出现在你的 Litefuse 控制台中。
第 1 步:安装依赖
pip install langfuse livekit-agents livekit-plugins-openai livekit-plugins-silero livekit-plugins-turn-detector opentelemetry-sdk python-dotenv第 2 步:配置 Langfuse SDK
设置你的 Litefuse API Key。可通过注册免费的 Litefuse Cloud 账号或 自托管 Litefuse 获取这些 Key。
LANGFUSE_SECRET_KEY = "sk-lf-..."
LANGFUSE_PUBLIC_KEY = "pk-lf-..."
LANGFUSE_BASE_URL = "https://litefuse.cloud"
第 3 步:设置 Litefuse Tracer Provider
创建一个共享的 TracerProvider,并将其同时传给 LiveKit(通过 set_tracer_provider)和 Langfuse SDK。Langfuse SDK 会自动在该 provider 上注册一个 exporter,将 span 发送到 Litefuse。
由于 LiveKit 会生成大量内部 span,请设置 should_export_span=lambda span: True,以便所有 telemetry 都被转发。
import os

from langfuse import Langfuse
from opentelemetry.sdk.trace import TracerProvider
from opentelemetry.util.types import AttributeValue

from livekit.agents.telemetry import set_tracer_provider

def setup_langfuse(
    metadata: dict[str, AttributeValue] | None = None,
    *,
    host: str | None = None,
    public_key: str | None = None,
    secret_key: str | None = None,
) -> TracerProvider:
    public_key = public_key or os.getenv("LANGFUSE_PUBLIC_KEY")
    secret_key = secret_key or os.getenv("LANGFUSE_SECRET_KEY")
    host = host or os.getenv("LANGFUSE_HOST") or os.getenv("LANGFUSE_BASE_URL")

    if not public_key or not secret_key or not host:
        raise ValueError(
            "LANGFUSE_PUBLIC_KEY, LANGFUSE_SECRET_KEY, and LANGFUSE_HOST (or LANGFUSE_BASE_URL) must be set"
        )

    trace_provider = TracerProvider()
    set_tracer_provider(trace_provider, metadata=metadata)

    Langfuse(
        public_key=public_key,
        secret_key=secret_key,
        base_url=host,
        tracer_provider=trace_provider,
        should_export_span=lambda span: True,
    )

    return trace_provider
第 4 步:在你的入口函数中使用 Tracer Provider
在 AgentSession.start() 之前调用 setup_langfuse()。你可以传入可选的元数据(如 langfuse.session.id),它会附加到每个 span 上。
from livekit.agents import AgentSession, JobContext, metrics
from livekit.agents.voice import MetricsCollectedEvent
from livekit.plugins import silero

async def entrypoint(ctx: JobContext):
    trace_provider = setup_langfuse(
        metadata={
            "langfuse.session.id": ctx.room.name,
        }
    )

    async def flush_trace():
        trace_provider.force_flush()

    ctx.add_shutdown_callback(flush_trace)

    session = AgentSession(vad=silero.VAD.load())

    @session.on("metrics_collected")
    def _on_metrics_collected(ev: MetricsCollectedEvent):
        metrics.log_metrics(ev.metrics)

    await session.start(agent=MyAgent(), room=ctx.room)
完整的端到端示例请见 GitHub。
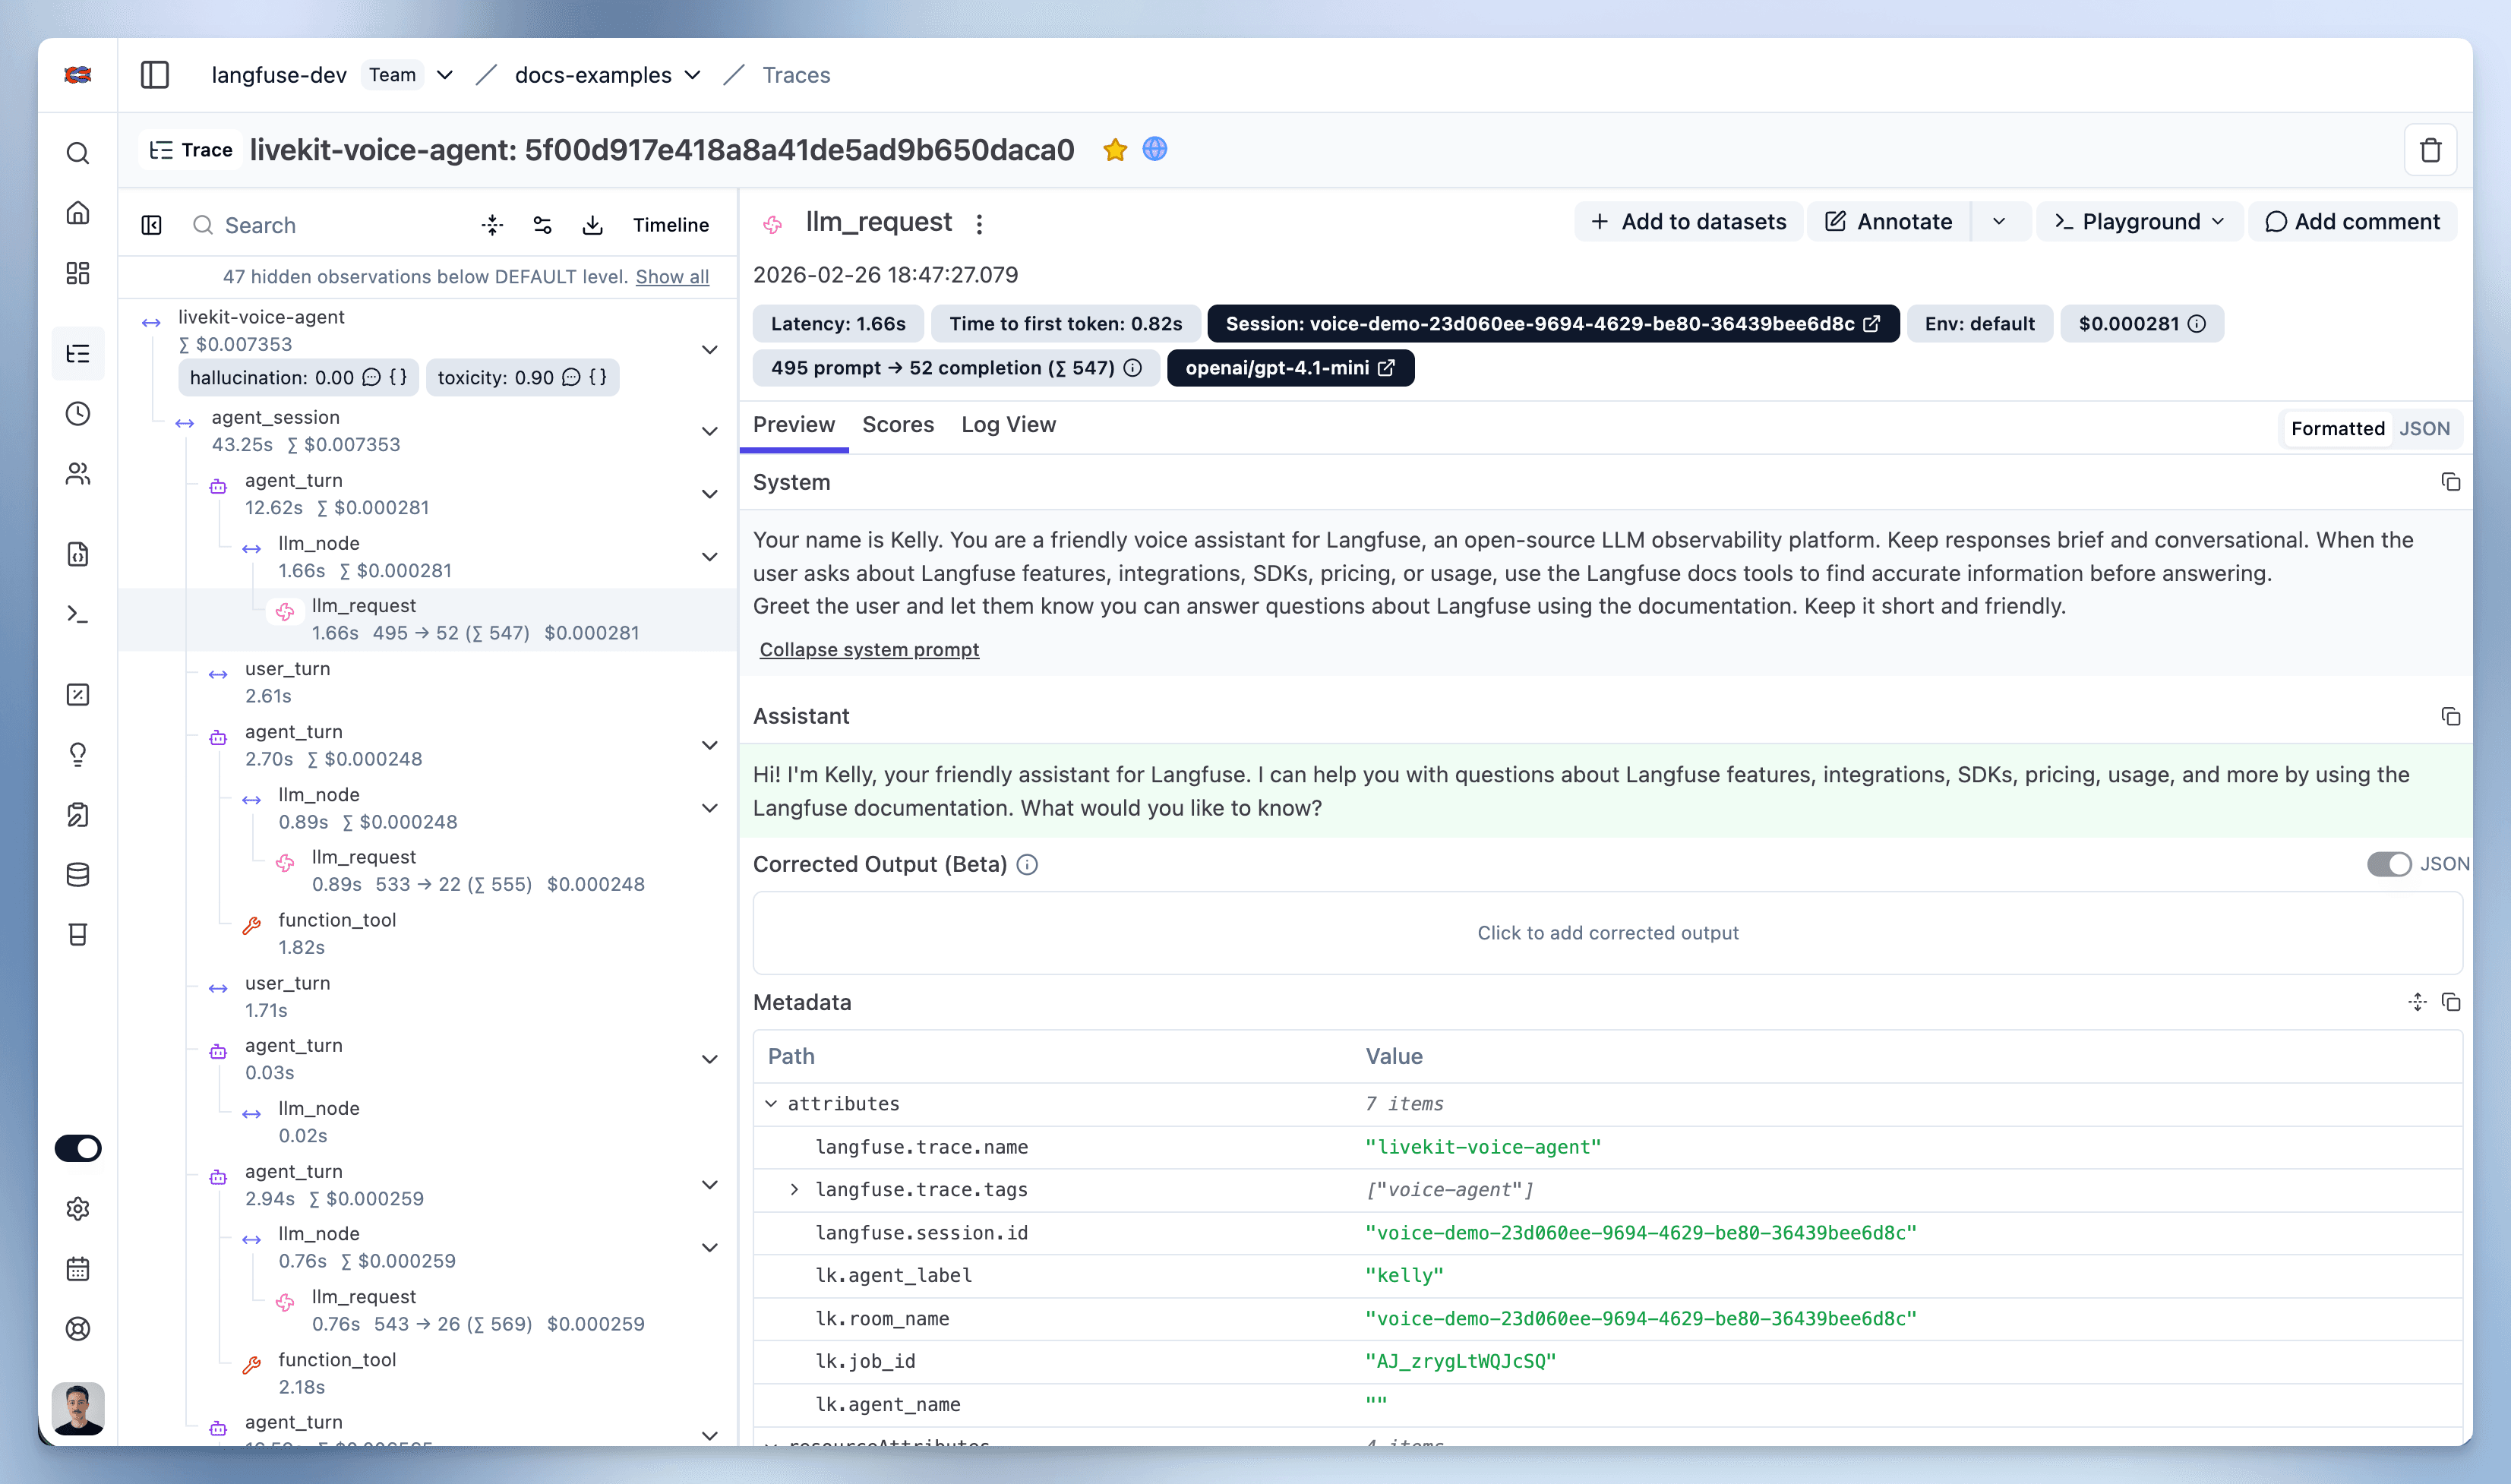
第 5 步:在 Litefuse 中查看 Trace
运行 Agent 后,进入你的 Litefuse Trace 表。你将看到 Agent 执行的详细 trace,包括每一个 Agent 步骤、工具调用、输入、输出以及性能指标的洞察。
Interoperability with the Python SDK
You can use this integration together with the Litefuse SDKs to add additional attributes to the observation.
The @observe() decorator provides a convenient way to automatically wrap your instrumented code and add additional attributes to the observation.
from langfuse import observe, propagate_attributes, get_client

langfuse = get_client()

@observe()
def my_llm_pipeline(input):
    # Add additional attributes (user_id, session_id, metadata, version, tags) to all spans created within this execution scope
    with propagate_attributes(
        user_id="user_123",
        session_id="session_abc",
        tags=["agent", "my-observation"],
        metadata={"email": "user@litefuse.ai"},
        version="1.0.0"
    ):

        # YOUR APPLICATION CODE HERE
        result = call_llm(input)

        return result

# Run the function
my_llm_pipeline("Hi")
Learn more about using the Decorator in the Langfuse SDK instrumentation docs.
Troubleshooting
No observations appearing
First, enable debug mode in the Python SDK:
export LANGFUSE_DEBUG="True"Then run your application and check the debug logs:
- OTel observations appear in the logs: Your application is instrumented correctly but observations are not reaching Litefuse. To resolve this:
- Call
langfuse.flush()at the end of your application to ensure all observations are exported. - Verify that you are using the correct API keys and base URL.
- Call
- No OTel spans in the logs: Your application is not instrumented correctly. Make sure the instrumentation runs before your application code.
Unwanted observations in Litefuse
The Langfuse SDK is based on OpenTelemetry. Other libraries in your application may emit OTel spans that are not relevant to you. These still count toward your billable units, so you should filter them out. See Unwanted spans in Litefuse for details.
Missing attributes
Some attributes may be stored in the metadata object of the observation rather than being mapped to the Litefuse data model. If a mapping or integration does not work as expected, please raise an issue on GitHub.
Next Steps
Once you have instrumented your code, you can manage, evaluate and debug your application: