使用 Litefuse 实现 Fireworks AI 的可观测性
本指南将介绍如何将 Fireworks AI 与 Litefuse 集成。Fireworks AI 的 API 端点与 OpenAI SDK 完全兼容,让你能够无缝追踪和监控 AI 应用。
什么是 Fireworks AI? Fireworks AI 是一个平台,通过兼容 OpenAI 的端点提供对最先进的开源和专有 AI 模型的 API 访问。
什么是 Litefuse? Litefuse 是一个开源的 AI Agent 可观测性与评估平台,帮助团队追踪 API 调用、监控性能并调试 AI 应用中的问题。
第一步:安装依赖
%pip install openai langfuse第二步:设置环境变量
import os

# Get keys for your project from the project settings page
# https://litefuse.cloud

os.environ["LANGFUSE_PUBLIC_KEY"] = "pk-lf-..."
os.environ["LANGFUSE_SECRET_KEY"] = "sk-lf-..."
os.environ["LANGFUSE_BASE_URL"] = "https://litefuse.cloud"

# Set your Fireworks API details
os.environ["FIREWORKS_AI_API_BASE"] = "https://api.fireworks.ai/inference/v1"
os.environ["FIREWORKS_AI_API_KEY"] = "fw_..."
第三步:使用 Litefuse OpenAI 替换方案
from langfuse.openai import openai

client = openai.OpenAI(
  api_key=os.environ.get("FIREWORKS_AI_API_KEY"),
  base_url=os.environ.get("FIREWORKS_AI_API_BASE")
)
第四步:运行示例
response = client.chat.completions.create(
  model="accounts/fireworks/models/llama-v3p1-8b-instruct",
  messages=[
    {"role": "system", "content": "You are a helpful assistant."},
    {"role": "user", "content": "Why is open source important?"},
  ],
  name = "Fireworks-AI-Trace" # name of the trace
)
print(response.choices[0].message.content)
第五步:在 Litefuse 中查看 trace
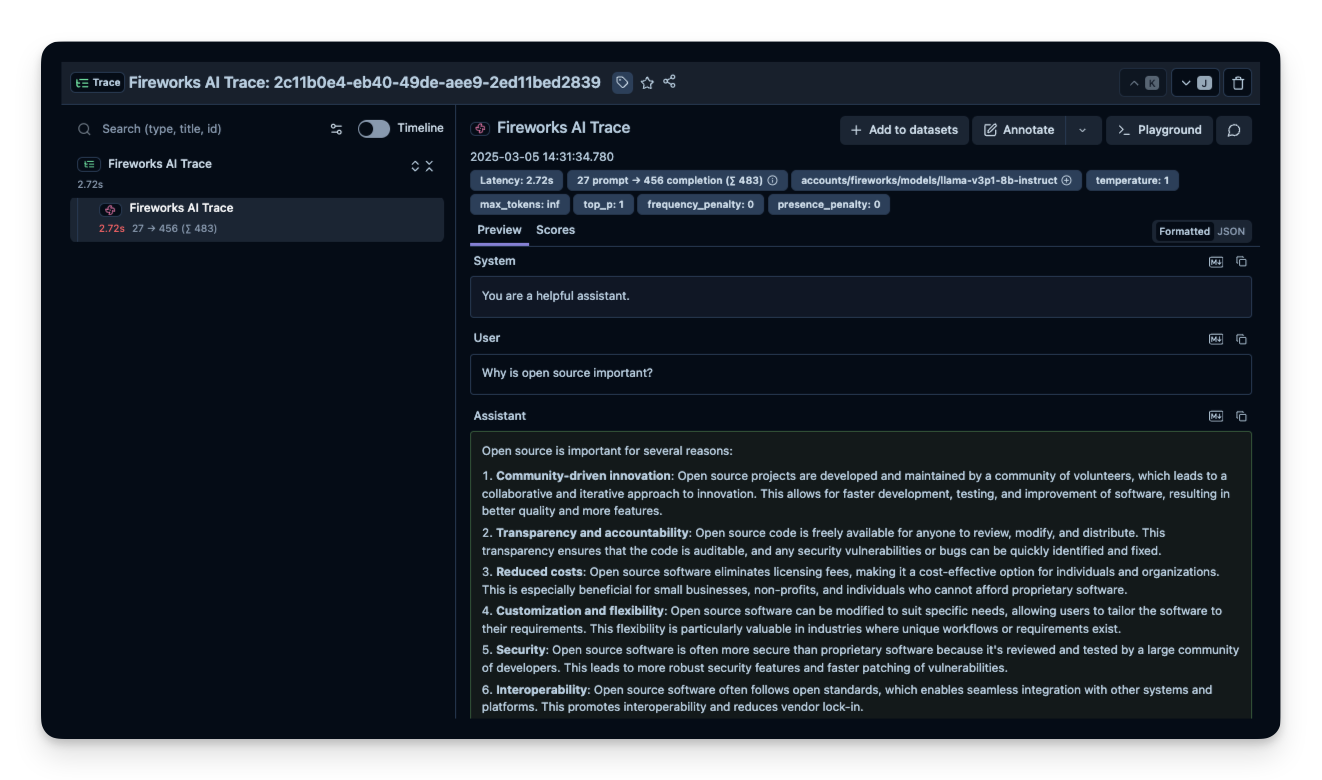
运行示例后,登录 Litefuse 即可查看详细的 trace,包括:
- 请求参数
- 响应内容
- token 用量和延迟指标
Interoperability with the Python SDK
You can use this integration together with the Litefuse SDKs to add additional attributes to the observation.
The @observe() decorator provides a convenient way to automatically wrap your instrumented code and add additional attributes to the observation.
from langfuse import observe, propagate_attributes, get_client

langfuse = get_client()

@observe()
def my_llm_pipeline(input):
    # Add additional attributes (user_id, session_id, metadata, version, tags) to all spans created within this execution scope
    with propagate_attributes(
        user_id="user_123",
        session_id="session_abc",
        tags=["agent", "my-observation"],
        metadata={"email": "user@litefuse.ai"},
        version="1.0.0"
    ):

        # YOUR APPLICATION CODE HERE
        result = call_llm(input)

        return result

# Run the function
my_llm_pipeline("Hi")
Learn more about using the Decorator in the Langfuse SDK instrumentation docs.
Troubleshooting
No observations appearing
First, enable debug mode in the Python SDK:
export LANGFUSE_DEBUG="True"Then run your application and check the debug logs:
- OTel observations appear in the logs: Your application is instrumented correctly but observations are not reaching Litefuse. To resolve this:
- Call
langfuse.flush()at the end of your application to ensure all observations are exported. - Verify that you are using the correct API keys and base URL.
- Call
- No OTel spans in the logs: Your application is not instrumented correctly. Make sure the instrumentation runs before your application code.
Unwanted observations in Litefuse
The Langfuse SDK is based on OpenTelemetry. Other libraries in your application may emit OTel spans that are not relevant to you. These still count toward your billable units, so you should filter them out. See Unwanted spans in Litefuse for details.
Missing attributes
Some attributes may be stored in the metadata object of the observation rather than being mapped to the Litefuse data model. If a mapping or integration does not work as expected, please raise an issue on GitHub.
Next Steps
Once you have instrumented your code, you can manage, evaluate and debug your application: