Firecrawl 集成
本指南演示如何将 Litefuse 与 Firecrawl 集成,追踪你的网页抓取操作。借助 Litefuse 的追踪能力,你可以自动捕获 Firecrawl 函数的输入、输出和执行时间等细节。
什么是 Firecrawl? Firecrawl 是一个 API 服务,可以爬取网站 —— 自动处理目标 URL 及其可访问的子页面 —— 并将抓取到的内容转换为干净、可直接喂给 LLM 的 markdown。它提供强大的抓取、爬取和抽取能力,可将网页内容(包括 HTML、元数据等)转换为各类应用所需的结构化数据。
什么是 Litefuse? Litefuse 是一个开源的 AI Agent 可观测性与评估平台,帮助团队追踪 API 调用、监控性能并调试 AI 应用中的问题。
快速开始
首先,安装必要的 Python 包:
%pip install langfuse firecrawl-py接下来,使用你的 Litefuse API Key 配置环境。你可以在 Litefuse 仪表盘获取这些 Key。
import os
# 从项目设置页面获取你项目的 Key:https://litefuse.cloud

os.environ["LANGFUSE_PUBLIC_KEY"] = "pk-lf-..."
os.environ["LANGFUSE_SECRET_KEY"] = "sk-lf-..."
os.environ["LANGFUSE_BASE_URL"] = "https://litefuse.cloud"
使用你的 Firecrawl API Key 初始化 Firecrawl 应用。
from firecrawl import FirecrawlApp
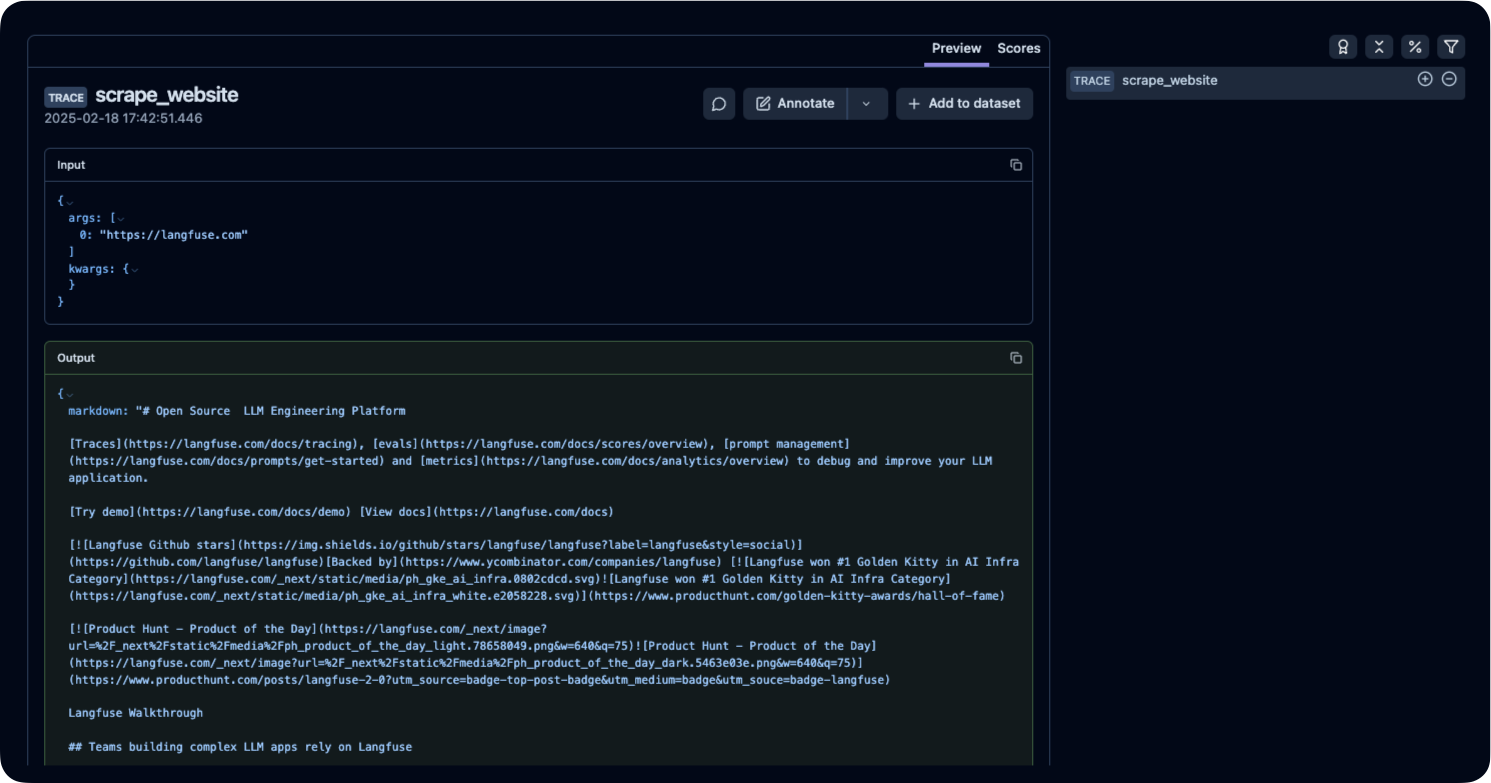
app = FirecrawlApp(api_key="fc-...")我们使用 Litefuse @observe() 装饰器 监控 Firecrawl 爬虫。在本示例中,@observe() 装饰器会捕获 scrape_website() 函数的输入、输出和执行时间。所有 trace 数据会自动发送到 Litefuse,让你能够实时监控 Firecrawl 操作。
from langfuse import observe

@observe()
def scrape_website(url):
  scrape_status = app.scrape_url(
    url,
    params={'formats': ['markdown', 'html']}
  )
  return scrape_status

scrape_website("https://litefuse.ai")
在 Litefuse 中查看 trace
执行完上述被追踪的函数后,登录你的 Litefuse 仪表盘 查看详细的 trace 日志。
Interoperability with the Python SDK
You can use this integration together with the Litefuse SDKs to add additional attributes to the observation.
The @observe() decorator provides a convenient way to automatically wrap your instrumented code and add additional attributes to the observation.
from langfuse import observe, propagate_attributes, get_client

langfuse = get_client()

@observe()
def my_llm_pipeline(input):
    # Add additional attributes (user_id, session_id, metadata, version, tags) to all spans created within this execution scope
    with propagate_attributes(
        user_id="user_123",
        session_id="session_abc",
        tags=["agent", "my-observation"],
        metadata={"email": "user@litefuse.ai"},
        version="1.0.0"
    ):

        # YOUR APPLICATION CODE HERE
        result = call_llm(input)

        return result

# Run the function
my_llm_pipeline("Hi")
Learn more about using the Decorator in the Langfuse SDK instrumentation docs.
Troubleshooting
No observations appearing
First, enable debug mode in the Python SDK:
export LANGFUSE_DEBUG="True"Then run your application and check the debug logs:
- OTel observations appear in the logs: Your application is instrumented correctly but observations are not reaching Litefuse. To resolve this:
- Call
langfuse.flush()at the end of your application to ensure all observations are exported. - Verify that you are using the correct API keys and base URL.
- Call
- No OTel spans in the logs: Your application is not instrumented correctly. Make sure the instrumentation runs before your application code.
Unwanted observations in Litefuse
The Langfuse SDK is based on OpenTelemetry. Other libraries in your application may emit OTel spans that are not relevant to you. These still count toward your billable units, so you should filter them out. See Unwanted spans in Litefuse for details.
Missing attributes
Some attributes may be stored in the metadata object of the observation rather than being mapped to the Litefuse data model. If a mapping or integration does not work as expected, please raise an issue on GitHub.
Next Steps
Once you have instrumented your code, you can manage, evaluate and debug your application: