将 Litefuse 与 LlamaIndex 集成
本 notebook 一步步演示如何将 Litefuse 与 LlamaIndex 集成,为你的 LLM 应用提供可观测性与调试能力。
LlamaIndex 是什么? LlamaIndex (GitHub) 是一个面向 LLM、用于接入私有数据的”数据框架”。它通过丰富的数据连接器,简化了对各种数据源和格式(API、PDF、文档、SQL 等)的集成,并将数据组织成 LLM 友好的索引与图。它还提供了一套精巧的检索/查询接口,可以为 LLM 的输入补充上下文相关的内容。
Litefuse 是什么? Litefuse 是一个开源的 AI agent 可观测性与评估平台。它提供 AI 应用的 trace 和监控能力,通过详尽的洞察以及对各种工具、框架的原生集成、OpenTelemetry 和专用 SDK,帮助开发者调试、分析和优化自己的 AI 系统。
开始使用
下面通过一个实际示例来看看如何使用 LlamaIndex,并将其与 Litefuse 集成做完整的 trace。
步骤 1:安装依赖
%pip install langfuse openinference-instrumentation-llama-index llama-index-llms-openai llama-index -U步骤 2:配置 Langfuse SDK
接下来配置 Litefuse 的 API key。你可以注册一个免费的 Litefuse Cloud 账号或者自托管 Litefuse 来获取这些 key。这些环境变量对 Langfuse 客户端的身份认证和数据发送至关重要。
import os

# Get keys for your project from the project settings page: https://litefuse.cloud

os.environ["LANGFUSE_PUBLIC_KEY"] = "pk-lf-..."
os.environ["LANGFUSE_SECRET_KEY"] = "sk-lf-..."
os.environ["LANGFUSE_BASE_URL"] = "https://litefuse.cloud"

# Your OpenAI key
os.environ["OPENAI_API_KEY"] = "sk-proj-..."
环境变量设好之后,就可以初始化 Langfuse 客户端了。get_client() 会根据环境变量中的凭据初始化 Langfuse 客户端。
from langfuse import get_client

langfuse = get_client()

# Verify connection
if langfuse.auth_check():
    print("Langfuse client is authenticated and ready!")
else:
    print("Authentication failed. Please check your credentials and host.")
步骤 3:初始化 LlamaIndex Instrumentation
接下来初始化 OpenInference 的 LlamaIndex instrumentation。这个第三方 instrumentation 会自动捕获 LlamaIndex 操作,并把 OpenTelemetry (OTel) span 导出到 Litefuse。
from openinference.instrumentation.llama_index import LlamaIndexInstrumentor

# Initialize LlamaIndex instrumentation
LlamaIndexInstrumentor().instrument()
步骤 4:一个基础的 LlamaIndex 应用
下面我们来写一个简单的 LlamaIndex 应用。这个例子里我们会创建一个能回答问题的 query engine,作为后面演示 Litefuse trace 的基础。
from llama_index.llms.openai import OpenAI

llm = OpenAI(model="gpt-4o")

with langfuse.start_as_current_observation(as_type="span", name="llama-index-trace"):
    response = llm.complete("Hello, world!")
    print(response)

langfuse.flush()
步骤 5:在 Litefuse 中查看 trace
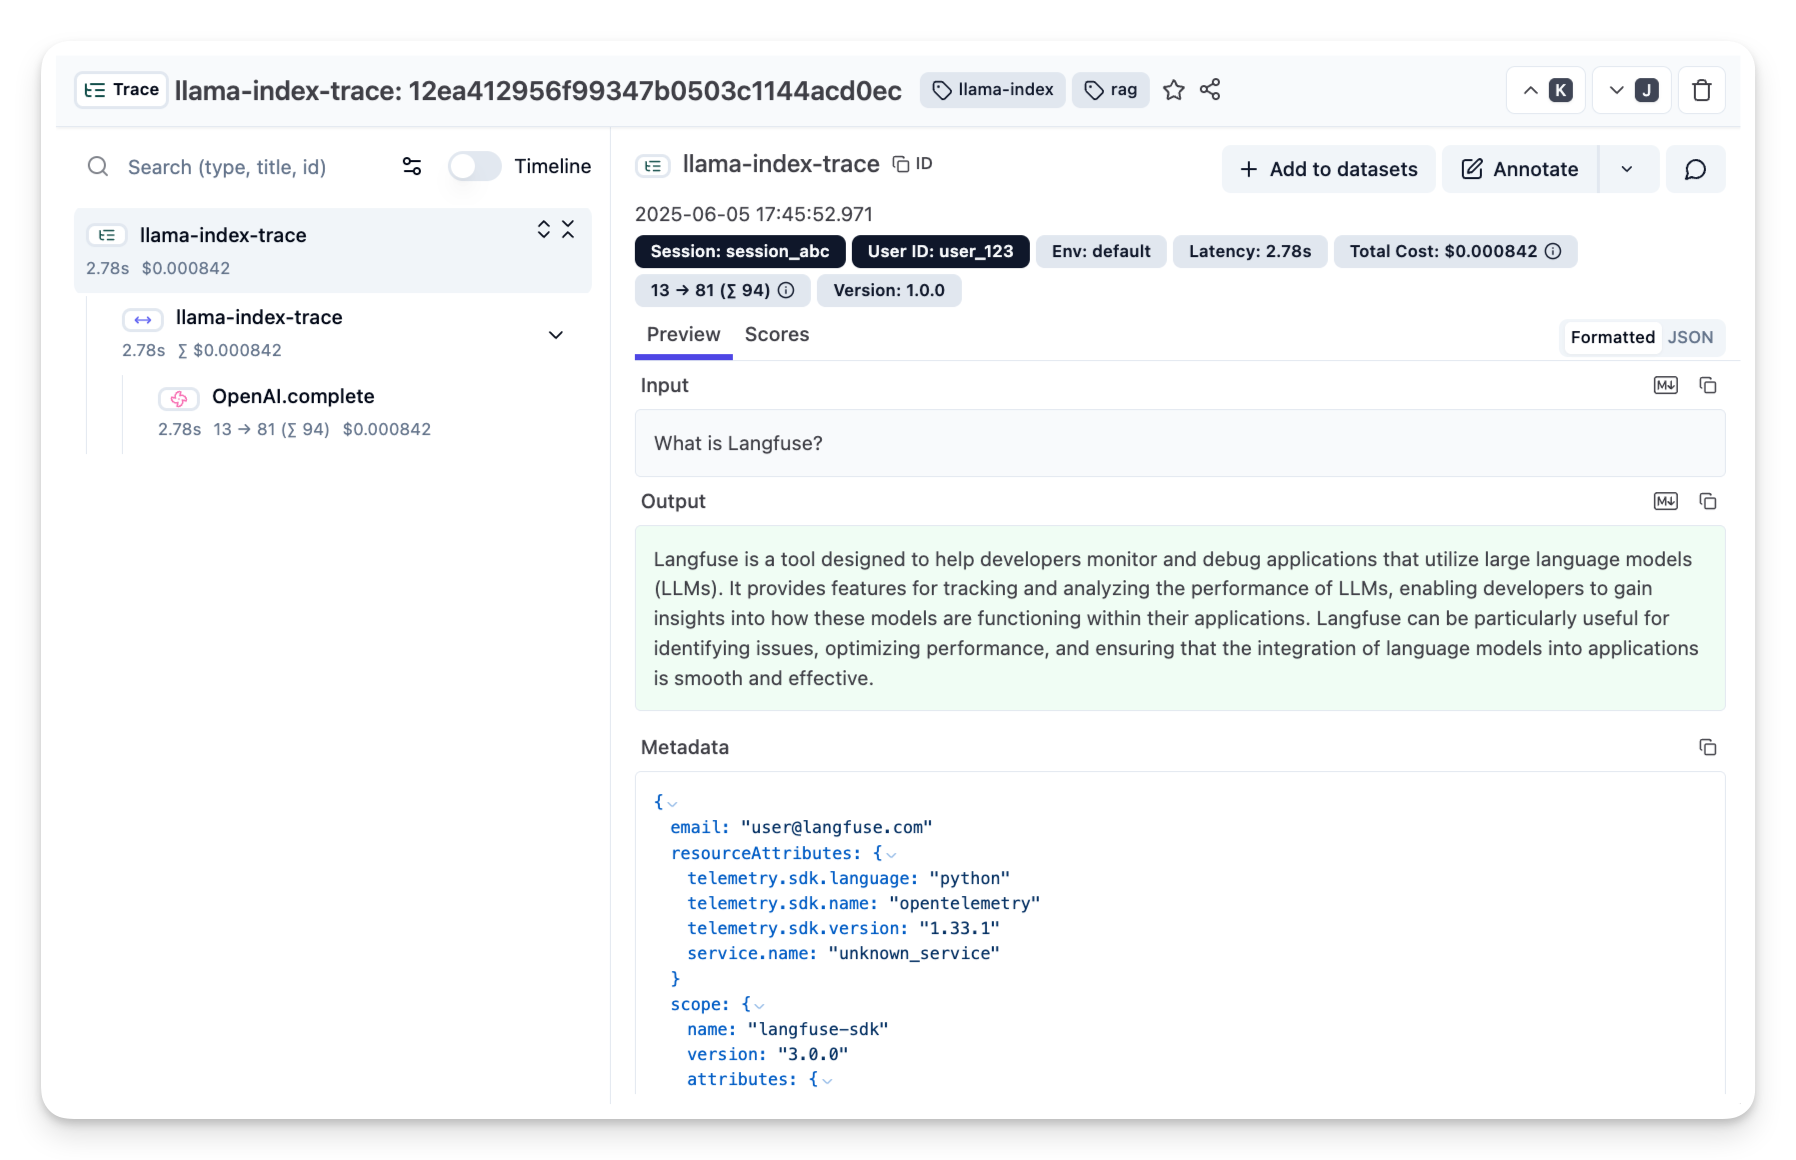
应用执行完后,打开 Litefuse 的 Trace Table,你会看到这次执行的详细 trace,包含 LLM 调用、检索操作、输入输出以及性能指标。trace 会完整展示从查询处理到文档检索再到响应生成的整个流程。
Interoperability with the Python SDK
You can use this integration together with the Litefuse SDKs to add additional attributes to the observation.
The @observe() decorator provides a convenient way to automatically wrap your instrumented code and add additional attributes to the observation.
from langfuse import observe, propagate_attributes, get_client

langfuse = get_client()

@observe()
def my_llm_pipeline(input):
    # Add additional attributes (user_id, session_id, metadata, version, tags) to all spans created within this execution scope
    with propagate_attributes(
        user_id="user_123",
        session_id="session_abc",
        tags=["agent", "my-observation"],
        metadata={"email": "user@litefuse.ai"},
        version="1.0.0"
    ):

        # YOUR APPLICATION CODE HERE
        result = call_llm(input)

        return result

# Run the function
my_llm_pipeline("Hi")
Learn more about using the Decorator in the Langfuse SDK instrumentation docs.
Troubleshooting
No observations appearing
First, enable debug mode in the Python SDK:
export LANGFUSE_DEBUG="True"Then run your application and check the debug logs:
- OTel observations appear in the logs: Your application is instrumented correctly but observations are not reaching Litefuse. To resolve this:
- Call
langfuse.flush()at the end of your application to ensure all observations are exported. - Verify that you are using the correct API keys and base URL.
- Call
- No OTel spans in the logs: Your application is not instrumented correctly. Make sure the instrumentation runs before your application code.
Unwanted observations in Litefuse
The Langfuse SDK is based on OpenTelemetry. Other libraries in your application may emit OTel spans that are not relevant to you. These still count toward your billable units, so you should filter them out. See Unwanted spans in Litefuse for details.
Missing attributes
Some attributes may be stored in the metadata object of the observation rather than being mapped to the Litefuse data model. If a mapping or integration does not work as expected, please raise an issue on GitHub.
Next Steps
Once you have instrumented your code, you can manage, evaluate and debug your application: