Litefuse Prompt 管理性能测试
本 notebook 对 Litefuse Prompt 管理做了一次性能基准测试:在不使用缓存(cache_ttl_seconds=0)的情况下,连续执行 1000 次拉取并编译 prompt 的操作,并测量其延迟。
实际使用中,这个延迟其实并不重要,因为 SDK 在客户端会对 prompt 做缓存。更多关于缓存的内容请参阅 Litefuse Prompt 管理文档。
测试包含网络延迟,所以绝对值会因地理位置和负载而异。可以通过直方图和汇总统计来对比相对差异,比如不同 SDK 版本之间、或是不同缓存配置之间的差别。
测试需要在已认证的项目中预先创建一个名为 perf-test 的 prompt。
%pip install langfuseimport os
# Get keys for your project from the project settings page
# https://litefuse.cloud
os.environ["LANGFUSE_PUBLIC_KEY"] = ""
os.environ["LANGFUSE_SECRET_KEY"] = ""
os.environ["LANGFUSE_BASE_URL"] = "https://litefuse.cloud"import time
import pandas as pd
import matplotlib.pyplot as plt
from tqdm.auto import tqdm
from langfuse import Langfuse
# Initialize Langfuse client from environment variables
langfuse = Langfuse()
assert langfuse.auth_check(), "Langfuse client not initialized – check your environment variables."N_RUNS = 1_000
prompt_name = "perf-test"
durations = []
for _ in tqdm(range(N_RUNS), desc="Benchmarking"):
start = time.perf_counter()
prompt = langfuse.get_prompt(prompt_name, cache_ttl_seconds=0)
prompt.compile(input="test") # minimal compile to include server‑side processing
durations.append(time.perf_counter() - start)
time.sleep(0.05)
durations_series = pd.Series(durations, name="seconds")stats = durations_series.describe(percentiles=[0.25, 0.5, 0.75, 0.99])
stats我们上一次的性能测试结果
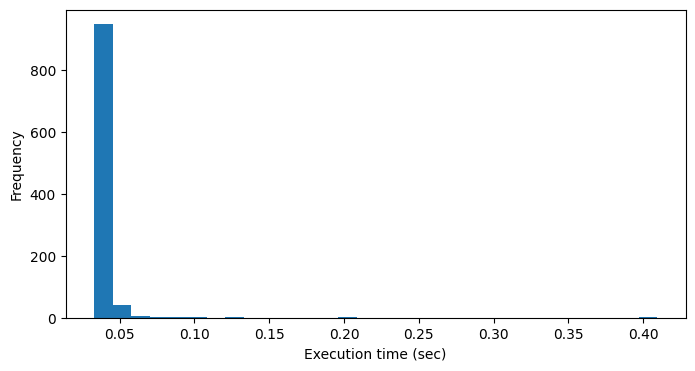
count    1000.000000
mean        0.039335 sec
std         0.014172 sec
min         0.032702 sec
25%         0.035387 sec
50%         0.037030 sec
75%         0.041111 sec
99%         0.068914 sec
max 0.409609 secplt.figure(figsize=(8,4))
plt.hist(durations_series, bins=30)
plt.xlabel("Execution time (sec)")
plt.ylabel("Frequency")
plt.show()我们上一次的性能测试结果
这个页面对你有帮助吗?