使用 OpenInference SDK 进行 trace
Litefuse 提供了 兼容 OpenTelemetry 的 SDK。借助 OpenInference instrumentation 库,你可以把多种其他框架的 trace 上报到 Litefuse。下面是把 OpenAI 的 trace 上报到 Litefuse 的示例,完整的支持框架列表见这里。要换成其他框架,只需把 instrumentor 换成对应框架的即可。
步骤 1:安装依赖
安装所需的 Python 包,启用 OpenTelemetry trace、OpenInference instrumentation,以及发起 LLM 请求所需的 OpenAI SDK。
%pip install langfuse openai openinference-instrumentation-openai --upgrade步骤 2:配置环境变量
为 basic auth header 设置你的 Litefuse API key。可以注册 Litefuse Cloud 或者自托管 Litefuse 来获取 Litefuse 的 API key。
同时把 OPENAI_API_KEY 也设为环境变量。
import os

# Get keys for your project from the project settings page: https://litefuse.cloud
os.environ["LANGFUSE_PUBLIC_KEY"] = "pk-lf-..."
os.environ["LANGFUSE_SECRET_KEY"] = "sk-lf-..."
os.environ["LANGFUSE_BASE_URL"] = "https://litefuse.cloud"

# Your openai key
os.environ["OPENAI_API_KEY"] = "sk-proj-..."
环境变量设好之后,就可以初始化 Langfuse 客户端了。get_client() 会根据环境变量中的凭据初始化 Langfuse 客户端。
from langfuse import get_client

langfuse = get_client()

# Verify connection
if langfuse.auth_check():
    print("Langfuse client is authenticated and ready!")
else:
    print("Authentication failed. Please check your credentials and host.")
Langfuse client is authenticated and ready!步骤 3:初始化 Instrumentation
我们使用 OpenAIInstrumentor 为 OpenAI SDK 注入 instrumentation。你也可以把它替换成这里支持的任意框架。
from openinference.instrumentation.openai import OpenAIInstrumentor

OpenAIInstrumentor().instrument()
步骤 4:执行一次示例 LLM 请求
启用 instrumentation 后,每一次 OpenAI API 调用都会被 trace。下面的例子发起一次 chat completion 请求来展示集成效果。
import openai
response = openai.OpenAI().chat.completions.create(
    messages=[
        {
            "role": "user",
            "content": "How does enhanced LLM observability improve AI debugging?",
        }
    ],
    model="gpt-4o-mini",
)
print(response.choices[0].message.content)
Enhanced observability in large language models (LLMs) plays a crucial role in improving AI debugging by providing deeper insights into model performance, behavior, and internal mechanics. Here are several ways in which enhanced observability can improve AI debugging:
1. **Detailed Monitoring**: Enhanced observability allows developers to monitor various metrics related to model performance in real time, such as accuracy, precision, recall, and F1 scores across different tasks. This helps identify specific areas where the model is underperforming.
2. **Data Drift Detection**: Observability tools can monitor incoming data distributions and detect drift over time. If the data the model encounters changes significantly from the training data, this can lead to degraded performance. Detecting data drift enables timely interventions, such as model retraining or adjustment.
3. **Error Analysis**: Enhanced observability tools can assist in logging and categorizing errors made by the model, such as misclassifications or inappropriate responses. By analyzing these errors, developers can pinpoint patterns and root causes, guiding debugging efforts more effectively.
4. **Model Interpretability**: Observability can be coupled with interpretability tools that provide insights into how a model makes decisions. By understanding the features or tokens that lead to certain outputs, developers can identify whether the model is relying on spurious correlations or misjudgments in particular contexts.
5. **Traceability**: With enhanced observability, it's possible to track the inputs and outputs of the model dynamically. This feature can help reproduce issues and understand the circumstances under which certain errors occur, facilitating quicker resolutions.
6. **User Feedback Integration**: Integrating user feedback into observability systems can provide qualitative insights into model performance. When users provide feedback on model outputs, it can highlight areas of misunderstanding or repeated errors that quantitative metrics may not reveal.
7. **Performance Variability Monitoring**: Tracking performance variability across different populations or contexts can uncover biases or inconsistencies in model behavior. By identifying and understanding these variances, developers can address fairness and ethical concerns more efficiently.
8. **Version Control and Experimentation**: Observability can provide a framework for tracking experiments with different model versions. This allows developers to understand how changes in training data, model architecture, or hyperparameters affect performance, making it easier to identify optimal configurations.
9. **Logging Contextual Information**: By capturing contextual information during model execution (e.g., user queries, environmental variables), developers can better understand the conditions that lead to specific outputs, making debugging more straightforward.
10. **Alerts and Anomaly Detection**: With enhanced observability, systems can automatically alert developers to anomalies in performance, enabling them to investigate and resolve issues proactively, rather than reactively waiting for user reports or performance drops.
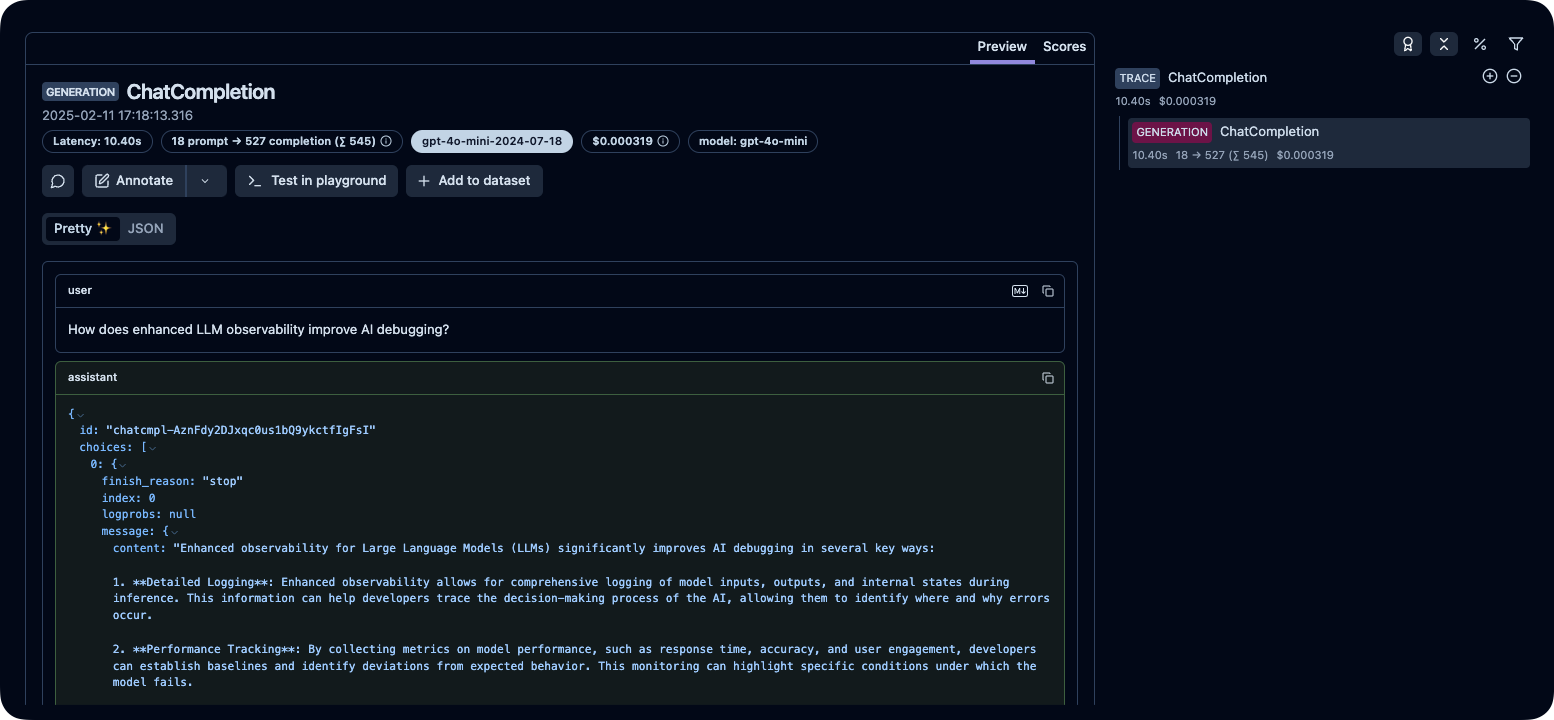
In conclusion, enhanced observability fosters a more proactive and informed debugging process for large language models. By improving transparency and understanding of the model's behavior, developers can diagnose issues more efficiently, refine model performance, and ultimately build more robust AI solutions.步骤 5:在 Litefuse 中查看 trace
运行上面的代码之后,你可以在 Litefuse 控制台中查看生成的 trace:
这个页面对你有帮助吗?