通过 OpenTelemetry 集成 MLflow
Litefuse 是一个 OpenTelemetry backend,可以接收来自各种 OpenTelemetry instrumentation 库的 trace。本指南演示如何使用 MLflow 的 instrumentation 库为兼容的框架或 LLM 提供商接入 trace。
步骤 1:安装依赖
安装必要的 Python 包:openai、langfuse 和 mlflow。它们能让你与 OpenAI 交互,并设置 trace 所需的 instrumentation。
注意: 本指南使用我们的 Python SDK v2。我们已经基于 OpenTelemetry 推出了全新升级的 SDK,欢迎查看 SDK v3,它更强大也更易用。
%pip install mlflow openai opentelemetry-exporter-otlp-proto-http "langfuse<3.0.0"步骤 2:配置环境变量
在发送任何请求前,你需要先配置好凭证和接入点。先填入你的 public key 和 secret key 完成 Litefuse 鉴权,然后配置 OpenTelemetry exporter 的 endpoint 和 headers,指向 Litefuse 的 backend。你还需要指定 OpenAI API key。
import os
import base64

LANGFUSE_PUBLIC_KEY = "pk-lf-..."
LANGFUSE_SECRET_KEY = "sk-lf-..."
LANGFUSE_AUTH = base64.b64encode(f"{LANGFUSE_PUBLIC_KEY}:{LANGFUSE_SECRET_KEY}".encode()).decode()

os.environ["OTEL_EXPORTER_OTLP_TRACES_ENDPOINT"] = "https://litefuse.cloud/api/public/otel/v1/traces"
os.environ["OTEL_EXPORTER_OTLP_TRACES_HEADERS"] = f"Authorization=Basic {LANGFUSE_AUTH}"
os.environ['OTEL_EXPORTER_OTLP_TRACES_PROTOCOL']= "http/protobuf"

# Set your OpenAI API key.
os.environ["OPENAI_API_KEY"] = "sk-proj-..."
配置 tracer_provider,并添加一个 span processor 把 trace 导出到 Litefuse。OTLPSpanExporter() 会从环境变量中读取 endpoint 和 headers。
from opentelemetry.sdk.trace import TracerProvider
from opentelemetry.exporter.otlp.proto.http.trace_exporter import OTLPSpanExporter
from opentelemetry.sdk.trace.export import SimpleSpanProcessor

trace_provider = TracerProvider()
trace_provider.add_span_processor(SimpleSpanProcessor(OTLPSpanExporter()))

# Sets the global default tracer provider
from opentelemetry import trace
trace.set_tracer_provider(trace_provider)

# Creates a tracer from the global tracer provider
tracer = trace.get_tracer(__name__)
说明: 这段代码配置了必要的环境变量。Litefuse 的 keys 被拼接后做 base64 编码,组成认证 token 并设置到 OTLP headers 中。同时,OpenTelemetry endpoint 用来把 trace 数据导向 Litefuse 的 backend。
步骤 3:初始化 Instrumentation
环境配置完成后,导入需要的库并初始化 MLflow instrumentation。所有可用的 instrumentation 模块可以参考这里。
import mlflow

# Enable the MLflow instrumentation for tracing OpenAI
mlflow.openai.autolog()
步骤 4:发起一次 Chat Completion 请求
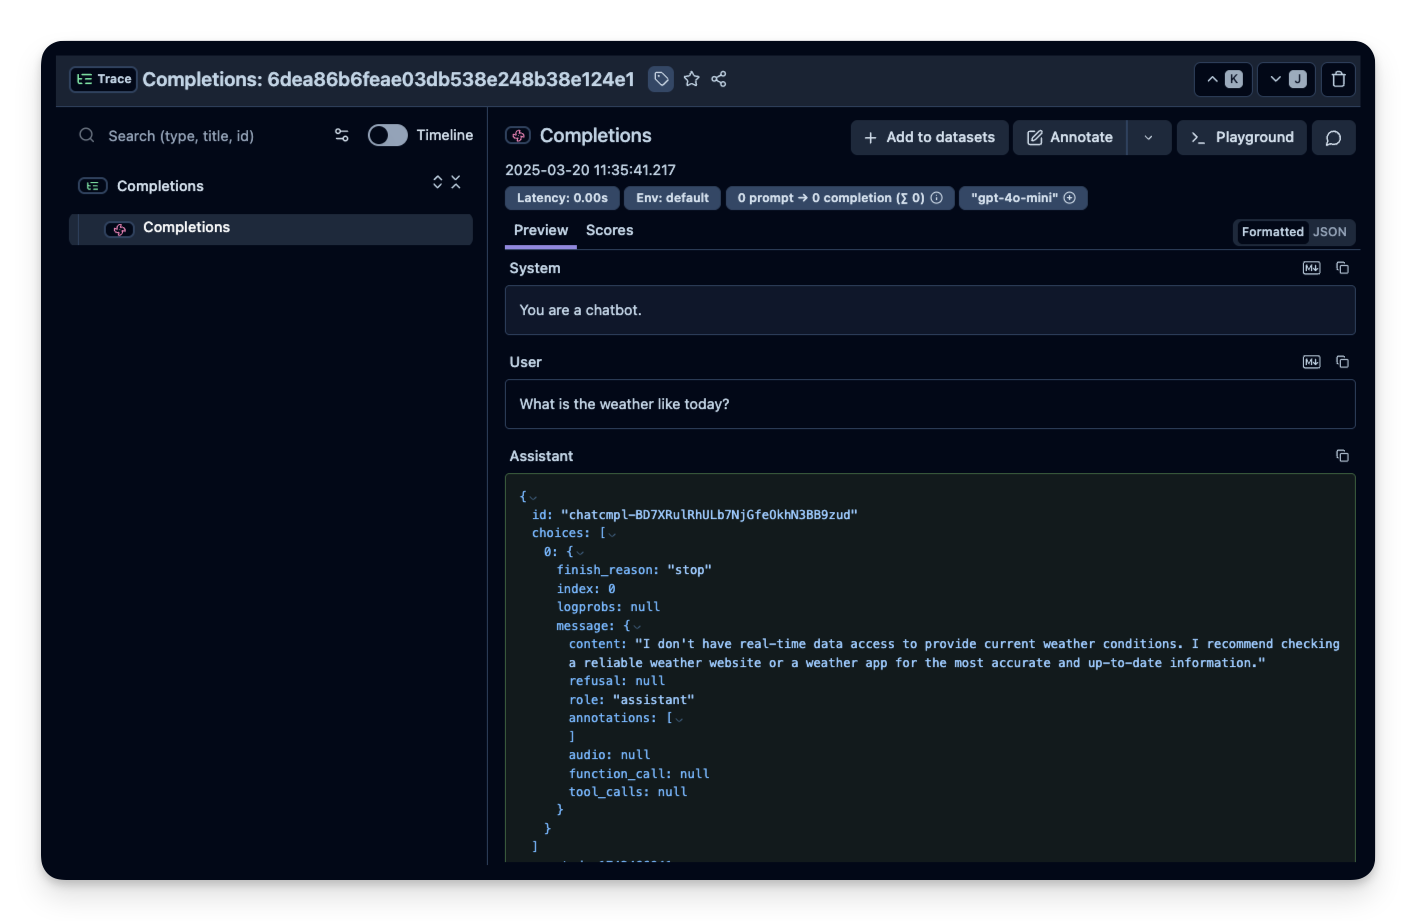
在本示例中,我们会向 OpenAI Chat API 发起一次简单的 chat completion 请求。这会产生 trace 数据,稍后你可以在 Litefuse dashboard 中查看。
import openai

# Use OpenAI Python SDK as usual
openai.OpenAI().chat.completions.create(
    model="gpt-4o-mini",
    messages=[
        {"role": "system", "content": "You are a chatbot."},
        {"role": "user", "content": "What is the weather like today?"},
    ],
)
ChatCompletion(id='chatcmpl-BD7XRulRhULb7NjGfeOkhN3BB9zud', choices=[Choice(finish_reason='stop', index=0, logprobs=None, message=ChatCompletionMessage(content="I don't have real-time data access to provide current weather conditions. I recommend checking a reliable weather website or a weather app for the most accurate and up-to-date information.", refusal=None, role='assistant', annotations=[], audio=None, function_call=None, tool_calls=None))], created=1742466941, model='gpt-4o-mini-2024-07-18', object='chat.completion', service_tier='default', system_fingerprint='fp_b8bc95a0ac', usage=CompletionUsage(completion_tokens=35, prompt_tokens=23, total_tokens=58, completion_tokens_details=CompletionTokensDetails(accepted_prediction_tokens=0, audio_tokens=0, reasoning_tokens=0, rejected_prediction_tokens=0), prompt_tokens_details=PromptTokensDetails(audio_tokens=0, cached_tokens=0)))步骤 5:传入额外的属性(可选)
OpenTelemetry 允许你通过 set_attribute 把一组属性挂载到所有 span 上。这样你就可以设置诸如 Litefuse Session ID 之类的属性(将 trace 按 session 归类),或 User ID(把 trace 关联到具体用户)。所有支持的属性列表见这里。
import openai

input = "How does enhanced LLM observability improve AI debugging?"

with tracer.start_as_current_span("OpenAI-Trace") as span:
    span.set_attribute("langfuse.user.id", "user-123")
    span.set_attribute("langfuse.session.id", "123456789")
    span.set_attribute("langfuse.tags", ["staging", "demo"])

    # You application code below:
    response = openai.OpenAI().chat.completions.create(
        messages=[
            {
                "role": "user",
                "content": input,
            }
        ],
        model="gpt-4o-mini",
    )
    print(response.choices[0].message.content)

    # Add input and output values to the new parent span
    span.set_attribute("input.value", input)
    span.set_attribute("output.value", response.choices[0].message.content)
2025/03/20 11:36:03 WARNING mlflow.utils.autologging_utils: Encountered unexpected error during openai autologging: the JSON object must be str, bytes or bytearray, not NoneType
Enhanced observability in Large Language Models (LLMs) plays a crucial role in AI debugging by providing deeper insights into the behavior, performance, and decision-making processes of these models. Here are some key ways in which improved observability aids in debugging:
1. **Monitoring Performance Metrics**: Enhanced observability allows for real-time tracking of various performance metrics such as accuracy, response time, and model drift. By continuously monitoring these indicators, developers can quickly identify when an LLM deviates from expected behavior, enabling timely interventions.
2. **Traceability of Inputs and Outputs**: Improved observability enables the logging and tracking of inputs and outputs, which helps in understanding how specific inputs influence model outputs. This traceability allows engineers to pinpoint the source of unexpected behavior or errors in the model's responses.
3. **Contextual Analysis**: By incorporating contextual information, observability tools can provide insights into the model's processing of input data, including how it interprets the context or nuances. Understanding the reasoning behind a model's output helps identify when and why it may misinterpret queries or generate inappropriate responses.
4. **Understanding Model Decisions**: Enhanced observability often involves explainable AI techniques such as feature importance analysis and attention visualization. These tools help in understanding which parts of the input were most influential in the model's decision-making process, thus revealing biases or weaknesses in the model.
5. **Anomaly Detection**: By establishing baselines for normal model behavior, enhanced observability systems can detect anomalies in responses. This capability helps in identifying potential issues that may not be apparent through traditional testing methods or user feedback alone.
6. **Testing and Validation**: Enhanced observability can support ongoing testing and validation of LLMs by providing insights into how the model performs across different scenarios and datasets. This testing can help identify gaps in training data or areas where the model may require additional fine-tuning.
7. **Feedback Loops**: Observability facilitates the creation of feedback loops where user interactions and model performance data can be used to continuously improve the model. This iterative process helps rectify shortcomings and refine the model's outputs over time.
8. **Collaboration and Communication**: Enhanced observability provides a shared understanding of model behavior among teams. This improved visibility fosters better communication between data scientists, engineers, and stakeholders, leading to more informed decision-making regarding model improvements and debugging efforts.
9. **Compliance and Ethical Considerations**: With enhanced observability, it becomes easier to assess models against compliance and ethical standards. Debugging efforts can include the identification of biases or harmful outputs, ensuring the model adheres to ethical AI principles.
In summary, enhanced observability in LLMs significantly improves AI debugging by providing comprehensive insights into model behavior, facilitating the identification of issues, and enabling more effective interventions. This ultimately leads to the development of more reliable, robust, and ethical AI systems.步骤 6:在 Litefuse 中查看 trace
你可以在 Litefuse 中查看生成的 trace 数据。可以在 Litefuse UI 中查看这个示例 trace。
m